Irrelevance – the pollution of the Online Media World?

Pollution Protecting the real world from the ravages of pollution and preserving our natural resources was once considered the preserve of environmental activists. Not anymore. Recycling, energy conservation and reducing our carbon footprint are now mainstream activities.

In the Online Media World I would suggest the equivalent to pollution is irrelevance, and the time, and money, that are wasted dealing with it (never mind the frustration caused). Unfortunately the PR industry is one of the culprits in producing this pollution; with the interesting stories it does create often getting lost in the millions of press releases produced each year, many of which are often sent to significant numbers of people for whom they are irrelevant. This means only a small proportion of these messages actually lead to someone talking about a story.

The positive response to our recent Online PR animation suggests that many (all?) people in the PR industry are aware of the importance of remembering that there are real people at the end of each of these messages. Given this, if irrelevance is polluting their environment shouldn’t we all be asking one simple question:

What have we done to improve our relevance today?

For us at RealWire this means making sure the existing things we do to improve our relevance are performed 100 per cent and looking for new ways to reduce our “irrelevance footprint” all the time. Many of these improvements and processes are based on feedback from the receivers of our news themselves. Some things are simple, the equivalent to turning the light off when you leave a room or not leaving your TV on standby, and others take more effort and investment on our part. They all have one end purpose though – to deliver greater relevance to all the receivers of our news and so reduce the amount of pollution we create.

We realise we’re far from perfect, but then how many people recycle 100 per cent of their waste in the real world? Does that mean that we shouldn’t all try and recycle more just because perfection is probably unattainable? That’s why we are always looking to improve. After all it is only through delivering relevance that the PR industry can ever hope to release the influence it desires.

I noticed today that PRNewswire have recently started to provide their content through sector specific Twitter feeds e.g. PRNTech, rather than all through one single feed. RealWire also did this a few months ago as we realised, as PRN would appear to, that people following news content would find this would significantly improve the relevance of the content to them. It’s not rocket science, nor is turning off your TV, and it won’t solve the problem of PR pollution by itself, but as with the environment a lot of small individual measures can make a big difference overall.

So hats off to PRN for also taking this step and perhaps we could all ask ourselves what have we done today to improve the environment in the Online Media World we all inhabit?

Government 2010 I’ll be the one trying to keep up

G2010

Government 2010 is a one day conference on 22nd October that in the organisers words “will examine how next generation government is set to change in the light of social, media and technology change.” [Disclosure: Realwire is one of the media sponsors].

I will be part of the panel discussing the impact of blogging and social media. Given the quality of the panel – Iain Dale (Dales Diary), Mick Fealty (Slugger O’Toole), Stephen Tall (Editor LibDem Voice) and Craig Elder (Conservative Online Communities Editor) – I may be like the celebrity on Question Time who has to try and keep up with the rest. Except without the celebrity :-)

The line up for the event as a whole is very high quality and by the wonders of streaming you don’t even need to travel to the venue (though you can if you wish), as the whole event will be broadcast live.

To get the conversation started the organisers have put together a quick survey about the impact of technology and new media on government and the political landscape. (Note you can skip questions if you would prefer not to disclose information like your voting preference).

As politics and new media are two of my favourite topics I am really looking forward to the day. Hope you can join us –  either in person or virtually.

Apple’s brand not core to its success

Interbrand published their list of the top 100 global brands for 2009 last week, Coca Cola maintaining its position at the top for the ninth year in a row. I thought it would be interesting to compare the brand values calculated by Interbrand with the equity values of the companies concerned as it would indicate those companies with the most to lose (and gain) through their PR and reputation management.

The results for some companies are surprising including the banks, JP Morgan and HBSC, and in particular Apple, who it seems is not very reliant on its brand with only 9% of its company valuation represented by its brand value.

Interbrand’s  methodology effectively values the extent to which a brand is able to generate financial benefits due to the superior demand created through the strength of the brand itself and not the underlying assets, expertise etc of the company.

Comparing this brand value with the company’s stock market value effectively gives an assessment of the extent to which the brand itself is the driver of the company’s performance.

The table below shows the top 50 brands in the Interbrand list sorted in descending order by those whose brands represent the highest proportion of their company valuation. (The position figure is their position in the Interbrand list).

Top of this list is the French company PPR who own the Gucci Group and Puma amongst others. These two brands alone are valued by Interbrand at $11.4bn compared to a stock market value today for PPR of $16.1bn (£11bn) i.e. 71% of the company valuation is accounted for by the brand value of these two brands. Another luxury brand that appears high in the list, with 53% of its value accounted for by its two biggest brands, is Louis Vuitton Moet Hennessy.  This doesn’t seem surprising given the importance of brand in establishing luxury items’ worth.

Bottom of the list are the banks JP Morgan and HBSC. Only 5% of their company valuations is accounted for by their brand values. However this is not a credit crunch effect as this figure has not changed much over the last two years. This seems a little strange to me on the face of it as it implies that the banking sector is much more of a commodity market despite the importance of trust and confidence in this sector.

But more surprising still is Apple. According to Interbrand only 9% ($15.4bn) of the company’s value ($165.7bn) is accounted for by its brand. This compares to 25% for Microsoft and 42% for Sony. This implies that Apple’s brand is not considered an important driver of value in the company and yet I would suspect that most communications and marketing people would perceive that the opposite was the case.

I wonder if the majority of the reason why Apple is valued at 32 times its earnings (as of 21/9/09) driven by high expectations of its ability to innovate and design new products now and into the future and not the Apple brand itself?

Anyone else have any theories?

Position in Survey Company Ticker

Brand value
$bn

Equity value
$bn
Brand value as % of equity value
41 Gucci/Puma (PPR) PP:PAR 11.4 16.1 71%
15 BMW BMWX:GER 21.7 32.3 67%
5 Nokia NOK 34.9 57.8 60%
48 Heinz HNZ 7.2 12.5 58%
34 Kelloggs K 10.4 18.7 56%
1 Coca Cola KO 68.7 124.6 55%
10 Disney DIS 28.5 52.9 54%
16 Louis Vuitton/Moet (LVMH) MC:PAR 24.9 47.3 53%
6 McDonalds MCD 32.3 62.2 52%
12 Mercedes Benz (Daimler AG) DAI 23.9 49.9 48%
26 Nike NKE 13.2 28.5 46%
29 Sony SNE 12.0 28.4 42%
2 IBM IBM 60.2 160.1 38%
22 American Express AXP 15.0 41.3 36%
42 Phillips PHG 8.1 23.4 35%
35 Dell DELL 10.3 32.6 32%
21 H&M HMB:STO 15.4 49.2 31%
49 Ford F 7.0 22.4 31%
45 Accenture ACN:NYQ 7.7 25.6 30%
18 Honda HMC 16.8 55.9 30%
40 Thomson Reuters TRI 8.4 28.3 30%
9 Intel INTC 30.6 109.5 28%
4 General Electric GE 47.8 175.3 27%
39 Nintendo 7974:TYO 9.2 33.9 27%
3 Microsoft MSFT 56.6 225.1 25%
8 Toyota TM 31.3 130.5 24%
46 Ebay EBAY 7.4 31.4 24%
11 HP HPQ 24.1 109.4 22%
36 Citibank C 10.3 48.3 21%
33 Canon CAJ 10.4 49.3 21%
19 Samsung A005930:KSC 17.5 85.1 21%
7 Google GOOG 32.0 155.6 21%
27 SAP SAPX 12.1 59.3 20%
17 Marlboro (Philip Morris) PM 19.0 93.2 20%
43 Amazon AMZN 7.9 39.0 20%
31 UPS UPS 11.6 58.4 20%
50 Zara (Inditex) ITX:MCE 6.8 36.5 19%
14 Cisco CSCO 22.0 135.5 16%
30 Budweiser (AB InBev) AHBIF 11.8 73.9 16%
13 Gillette/Duracell (Procter and Gamble) PG 26.4 167.3 16%
23 Pepsi PEP 13.7 93.3 15%
44 Loreal OR:PAR 7.7 57.2 13%
24 Oracle ORCL 13.7 108.4 13%
38 Goldman Sachs GS 9.3 93.7 10%
20 Apple AAPL 15.4 165.7 9%
47 Siemens SI 7.3 84.4 9%
25 Nescafe (Nestle) NESN:VTX 13.3 154.2 9%
37 JP Morgan JPM 9.6 176.8 5%
32 HSBC HCS 10.5 204.8 5%
28 IKEA 12.0
Total 945.3 3925.0 24%
IKEA figures not calculated as privately owned so no stock market valuation available
Equity valuations were as of 21st September 2009
Tickers refer to New York Stock Exchange except where stated
Where currencies have been translated the following rates to $1 were used:
Euro = 0.682
Yen = 92
Korean Won = 1,204
Canadian $ = 1.077
Swiss Franc = 1.04

PR Industry beating the market in 2009 and then some

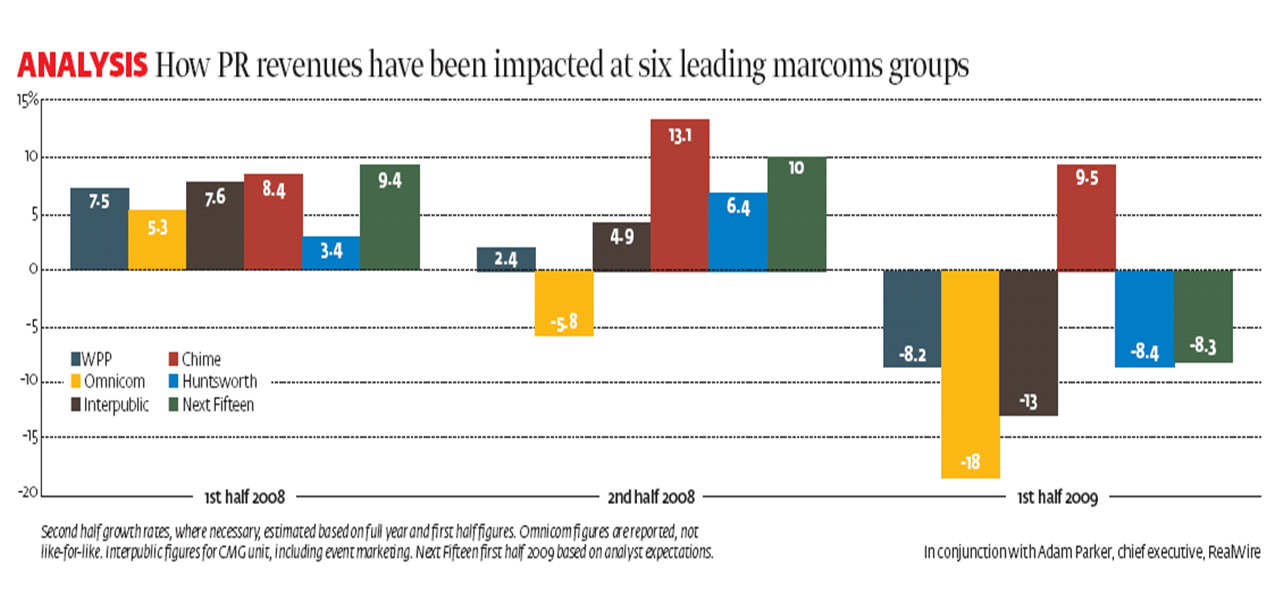
I helped PRWeek pull together some analysis last week of the results of the PR elements of some key Marcoms groups. The results can be seen in the graph below (you will need to access the original file to see clearly. Notes at the end of this post re: sources and basis of data). What the graph very clearly shows is the (unsurprising) turnaround in fortunes of these groups from generally healthy growth rates in 2008, even in the second half in most cases, to substantial falls in the first half of 2009. The exception being Chime Communications who have bucked the trend and grown 9.5% in the first half of 2009.

PR revenue comparison

To put these figures in context I thought I would delve a little further here and look at relative sizes and then look at the market’s view of PR via their share price performance.

Size

Income

The combined PR income of WPP, Interpublic and Omincom was still approximately £1bn in the first half of 2009 (though this includes Interpublic’s event marketing and branding business) and this in turn represented around 11% of their overall total revenues of around £9.5bn. This compares with approximately £115m of PR based revenue for Chime, Huntsworth and Next Fifteen combined in the same period which represents the majority of their circa £165m of total combined revenue. So the big three’s PR income is around 9 times more.

Market capitalisation

The combined market capitalisation of the three larger groups is approximately £16bn as at 7th September 2009 compared to approximately £300m for the three smaller ones. Over 50 times greater.

So given their relative size the results of the larger groups are a much stronger indicator of the overall global PR market’s current performance. However the higher proportion of PR income in the income of the smaller groups arguably makes them a better indicator of how the market perceives the PR industry’s prospects given that they are all (Chime excepted) suffering a reduction of PR income of broadly similar levels.

Share Price movements in 2009

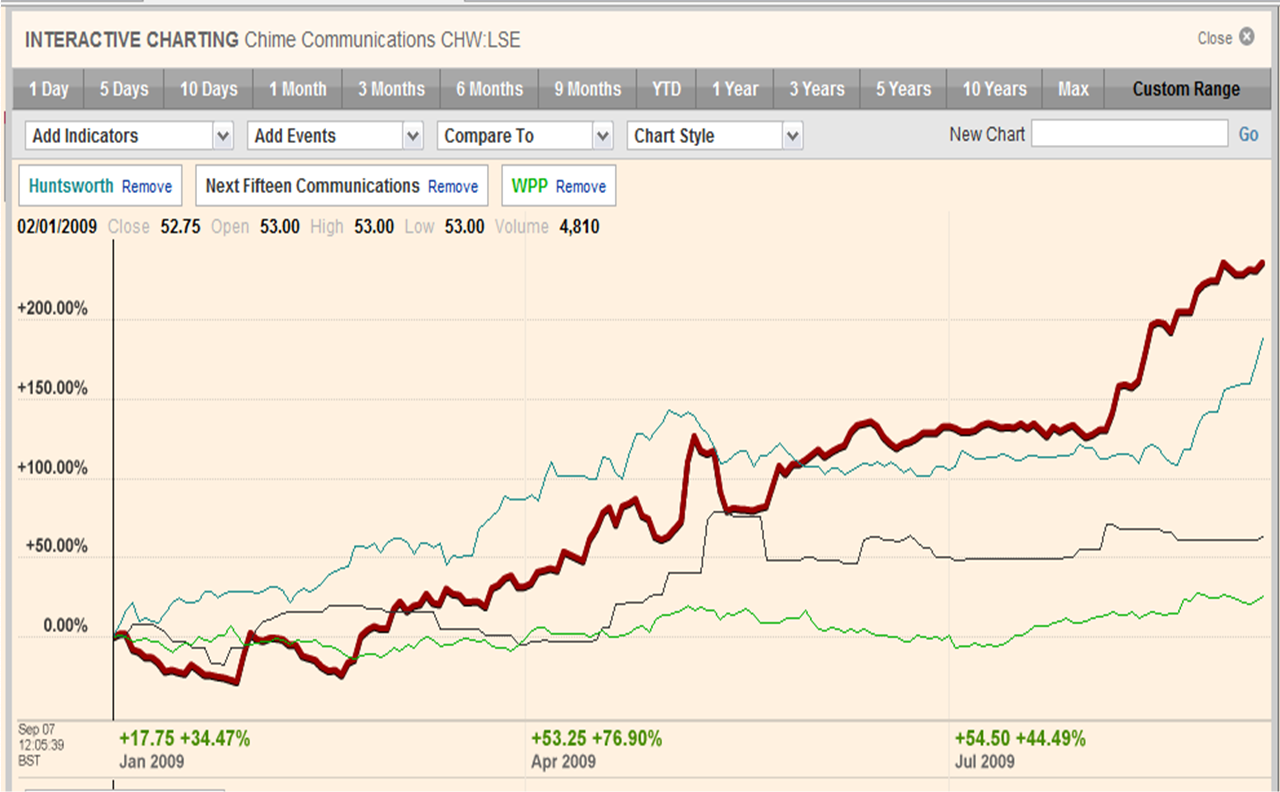
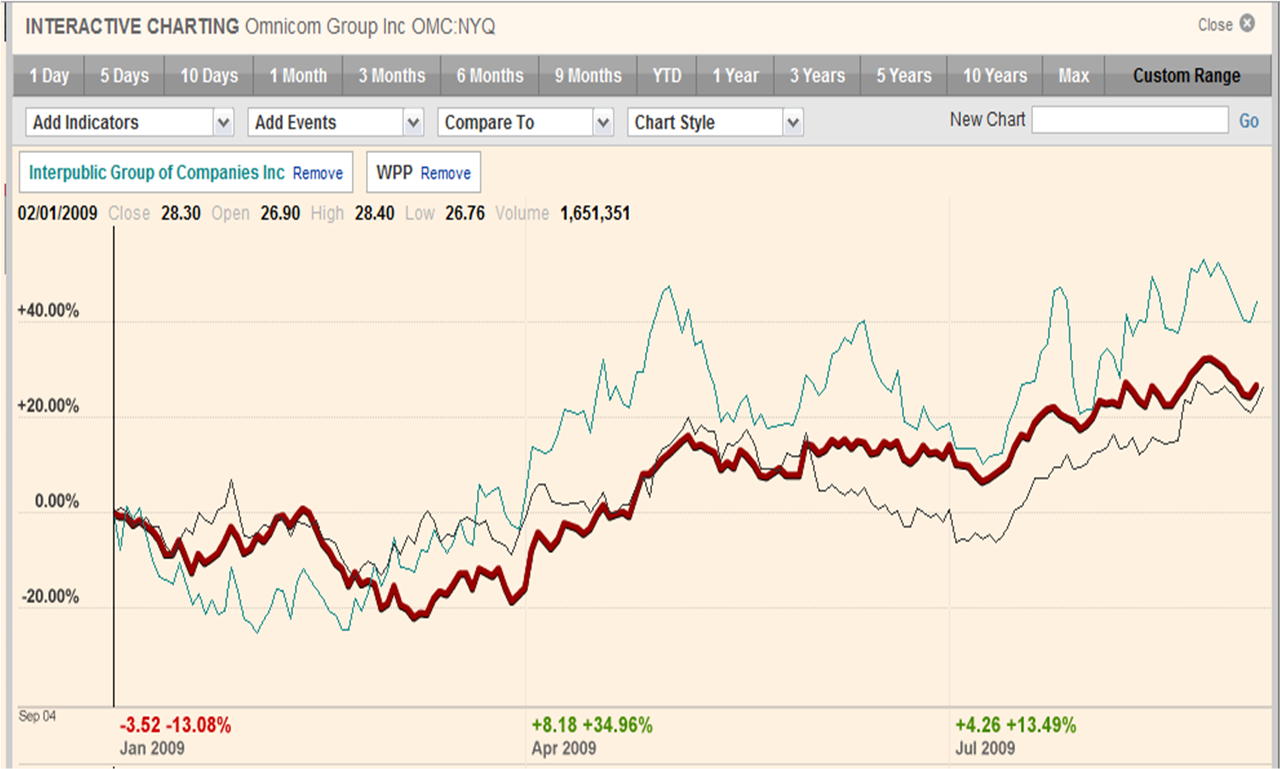
The graphs below show the movements in share prices of these same companies since the start of this calendar year. (Again you will probably need to view the actual files themselves – graph 1 – showing Chime, Huntsworth and Next Fifteen, graph 2 – showing Omnicom, Interpublic and WPP).

Comparison of PR group share prices Source FT.com

Comparison of Marcoms Groups share prices Source FT.com

The smaller groups that are either predominantly or wholly PR based (Chime, Huntsworth and Next Fifteen) have all outperformed the larger, broader, Marcoms groups during this period. Chime is up to over three times its level at the start of the year and Huntsworth isn’t far behind. Next Fifteen is also up around 60% despite predicting a significant fall in revenues in the first half of 2009. In fact their share prices are back to similar levels to where they were before the recession started.

This compares with increases of around 25-40% for the larger Marcoms groups. They have all therefore outperformed the market generally with the FTSE100 up approximately 10% and the DOW about 5% in the same period.

Of course given the difference in size the increases in the values of the larger groups are much greater in absolute £/$ terms than the smaller ones. However it is still interesting to note that these figures imply that the markets’ perceptions of the PR industry’s prospects has improved considerably over the last six months.

All of which suggests a healthy expectation of the industry’s performance in the coming months. Let’s hope they are right!

Sources/Basis

The analysis is based on publicly quoted figures included in investor presentations, interim and annual reports, SEC filings and in the case of Next Fifteen for 2009, analyst forecasts. Where possible the growth rates represent like for like organic growth excluding the impact of currency movements or acquisitions/disposals. Exceptions to this are Omnicom and Next Fifteen for whom these figures are headline changes as they do not disclose the impact of these items. Also Interpublic’s figures are based on their CMG division which includes their event marketing and branding businesses. If anyone is interested in the chapter and verse just contact me.

Byte Night 2009 – A sponsorship plea!

bytenight-logoI am taking part in ByteNight 2009 on 2nd October. Byte Night is an annual event where hundreds of people from the IT and business community agree to sleep rough for one night to raise money for Action for Children who help the UK’s most vulnerable children.

I will be joining the Newcastle/Gateshead group who will be “sleeping” at the Baltic Centre. If anyone would like to sponsor me then please visit my Just Giving page. Any contributions gratefully received.