An Inconvenient PR Truth – a campaign to reduce PR spam

We have launched a campaign today that aims to address the issue of irrelevant press release emails. To learn more watch the video below and then visit the An Inconvenient PR Truth website if you would like to get involved in the debate.

Update: We have posted answers to the main FAQs regarding the animation here. The debate has also moved onto PRWeek UK here.

PR Industry beating the market in 2009 and then some

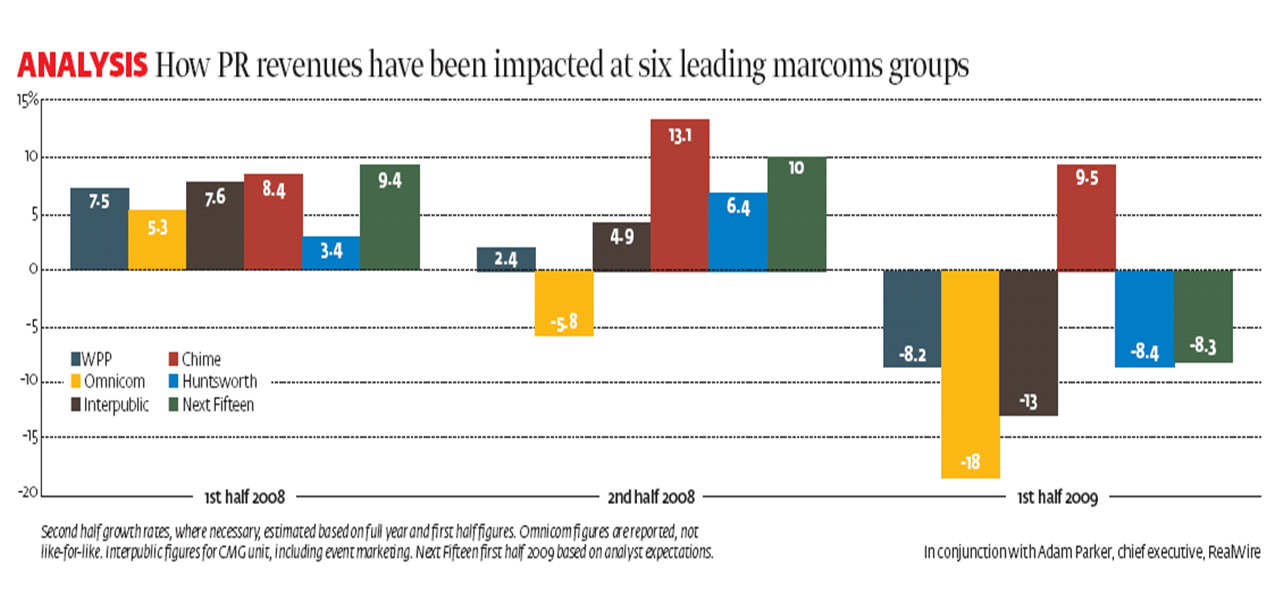
I helped PRWeek pull together some analysis last week of the results of the PR elements of some key Marcoms groups. The results can be seen in the graph below (you will need to access the original file to see clearly. Notes at the end of this post re: sources and basis of data). What the graph very clearly shows is the (unsurprising) turnaround in fortunes of these groups from generally healthy growth rates in 2008, even in the second half in most cases, to substantial falls in the first half of 2009. The exception being Chime Communications who have bucked the trend and grown 9.5% in the first half of 2009.

PR revenue comparison

To put these figures in context I thought I would delve a little further here and look at relative sizes and then look at the market’s view of PR via their share price performance.

Size

Income

The combined PR income of WPP, Interpublic and Omincom was still approximately £1bn in the first half of 2009 (though this includes Interpublic’s event marketing and branding business) and this in turn represented around 11% of their overall total revenues of around £9.5bn. This compares with approximately £115m of PR based revenue for Chime, Huntsworth and Next Fifteen combined in the same period which represents the majority of their circa £165m of total combined revenue. So the big three’s PR income is around 9 times more.

Market capitalisation

The combined market capitalisation of the three larger groups is approximately £16bn as at 7th September 2009 compared to approximately £300m for the three smaller ones. Over 50 times greater.

So given their relative size the results of the larger groups are a much stronger indicator of the overall global PR market’s current performance. However the higher proportion of PR income in the income of the smaller groups arguably makes them a better indicator of how the market perceives the PR industry’s prospects given that they are all (Chime excepted) suffering a reduction of PR income of broadly similar levels.

Share Price movements in 2009

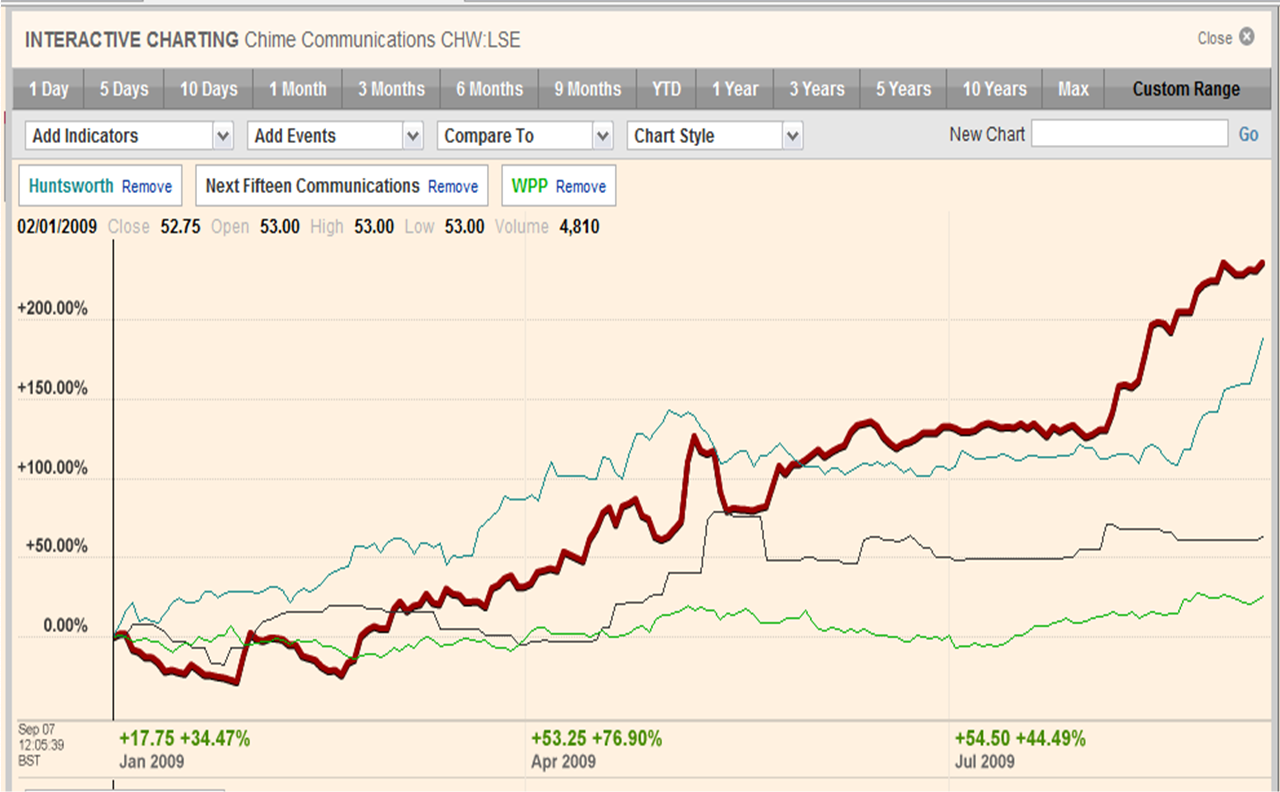
The graphs below show the movements in share prices of these same companies since the start of this calendar year. (Again you will probably need to view the actual files themselves – graph 1 – showing Chime, Huntsworth and Next Fifteen, graph 2 – showing Omnicom, Interpublic and WPP).

Comparison of PR group share prices Source FT.com

Comparison of Marcoms Groups share prices Source FT.com

The smaller groups that are either predominantly or wholly PR based (Chime, Huntsworth and Next Fifteen) have all outperformed the larger, broader, Marcoms groups during this period. Chime is up to over three times its level at the start of the year and Huntsworth isn’t far behind. Next Fifteen is also up around 60% despite predicting a significant fall in revenues in the first half of 2009. In fact their share prices are back to similar levels to where they were before the recession started.

This compares with increases of around 25-40% for the larger Marcoms groups. They have all therefore outperformed the market generally with the FTSE100 up approximately 10% and the DOW about 5% in the same period.

Of course given the difference in size the increases in the values of the larger groups are much greater in absolute £/$ terms than the smaller ones. However it is still interesting to note that these figures imply that the markets’ perceptions of the PR industry’s prospects has improved considerably over the last six months.

All of which suggests a healthy expectation of the industry’s performance in the coming months. Let’s hope they are right!

Sources/Basis

The analysis is based on publicly quoted figures included in investor presentations, interim and annual reports, SEC filings and in the case of Next Fifteen for 2009, analyst forecasts. Where possible the growth rates represent like for like organic growth excluding the impact of currency movements or acquisitions/disposals. Exceptions to this are Omnicom and Next Fifteen for whom these figures are headline changes as they do not disclose the impact of these items. Also Interpublic’s figures are based on their CMG division which includes their event marketing and branding businesses. If anyone is interested in the chapter and verse just contact me.

PRWeek Top 150 2009 Analysis – Who is best placed for 2009?

Following my recent podcast for PRWeek  on this years Top 150 (note requires subscription) I promised some detail on my findings. Since then there has been some debate about the worth of the table itself. From my point of view the table has two potential uses.

1. Ranking who are the largest (by income) PR Agencies in the UK
2. Showing how the PR industry is performing and the strategies that appear to be employed

Given that a substantial number of the largest entrants do not submit audited numbers (we will call these the Sarbanes agencies) I can understand why some have criticised its validity for the first use. Though I would humbly suggest that it is likely that the majority of the agencies that don’t submit figures would still occupy similar places to those estimated. Just not necessarily in the specific order.

But I definitely think the table has value for the second use. Allowing for agencies that have not submitted figures, or only have figures for one of the years, there are still 121 agencies in the list for which full figures have been supplied (we will call these the Audited agencies). These agencies account for approximately 60% of the combined income of the Top 150 and around two thirds of the staff. As a sample of the performance of the industry this is still a significant snap shot.

So I am going to leave the debate around point 1 to others and focus on the areas I discussed on the podcast around point 2.

What do we find?  

Summary table:

  Income change Staff change
Top 150 overall 11% 1%
Audited agencies 10% 2%
Sarbanes agencies 12% 0%

Income

Pretty consistent. And don’t think that’s because the Sarbanes estimates are all just the same. In fact the estimates range from a 22% reduction for one agency to a 36% increase for a couple of others.

Staff  

Again fairly consistent and again the estimates for the Sarbanes agencies do vary a lot from a reduction of 29% in one to an increase of 24% in another.

Different strategies  

But it is when you dig deeper, as I stated in the podcast, that you find the really interesting numbers.

Here are tables that stratify each of the groups based on their change in staff numbers year on year.

Audited agencies

Change in staff

No. of agencies

2008 Income £’m

2007 Income £’m

Change

2008 Staff

2007 Staff

Change

2008 Income / head£’000

2007 Income / head £‘000

Change

Significant increase

53

198

167

19%

2,252

1,905

18%

88

 88

0%

Little change

17

59

55

7%

639

623

3%

92

88

5%

Reduction

51

234

226

4%

2,435

2,698

-10%

96

84

15%

Total

121

491

448

10%

5,326

5,226

2%

92

86

8%

Sarbanes agencies

Change in staff

No. of agencies

2008 Income £’m

2007 Income £’m

Change

2008 Staff

2007 Staff

Change

2008 Income / head£’000

2007 Income / head£’000

Change

Significant increase

7

83

68

22%

793

701

13%

105

97

8%

Little change

7

113

99

14%

739

737

0%

153

134

14%

Reduction

9

159

150

6%

1,054

1,155

-9%

151

130

16%

Total

23

355

317

12%

2,586

2,593

0%

137

122

12%


A “Significant increase” with regards to staff numbers is defined as 5% or more; “Little change” is defined as 0-4.9%.

What you can see from the tables is that they are consistent in showing the following:

– The Reduction group is the largest by value of income in both cases. By value almost half of agencies reduced headcount in 2008 according to these numbers.

– The Reduction group increased income per head by the biggest percentage – 15% in the Audited agencies case 16% in the Sarbanes case.

– The Significant increase group achieved the highest income increase in both cases (19% Audited; 22% Sarbanes) but the smallest increase in income per head – 0% Audited and 8% Sarbanes.

Analysis  

1. The data consistently tells the same story whether audited or estimated. This is despite the significant variability in those estimates.

2. The headline numbers hide a wide variation in strategies that agencies have apparently being employing:

– Staffing up for growth
– Maintaining staff levels and apparently looking for margin improvement
– Reducing headcount to enhance profitability significantly

Implications

The question this poses is which of these groups are best placed for this year?

Have those that have gone for staff growth acquired the cream, and those with the most marketable skills, and so will be best placed to weather the storm? Have those that have gone for maintenance taken the right route as their teams and their client relationships may therefore be the most stable?

Or have those that have gone for an early reduction in headcount made the right call by reducing their cost bases before the recession bit the hardest?

I would be very interested to know the thoughts of those of you who have first hand experience of this discussion.

PRWeek Top 150 2009 Podcast

PRWeek were kind enough to invite me to do this week’s podcast on the newly announced Top 150 2009. Not sure if Wadds previous kind words influenced this and a big thanks to Peter Hay and Cathy Wallace who trusted me with the figures pre publication so I could do my analysis. Fortunately I managed to avoid doing a Blears/Quick at PRDebate on Tuesday :-)

Podcast can be found here and the Top 150 2009 can be downloaded by subscribers here.

I will be publishing my analysis behind some of my comments in the next couple of days for anyone who is interested in more detail.

Update: Embed code now available so view podcast below.

If Freakonomics covered the pitching issue

The provision of pitches by the PR Industry to the receivers of news would appear to suffer from a significant level of inefficiency in the allocation of resources. This is due to PR suppliers charging too high a price for a given level of demand. Over supply to the most in demand journalists leads to frustration for them, and a lack of productivity and efficiency on the part of the PRs, causing reduced profitability.

To improve this situation the industry needs to invest, either internally or via external suppliers, in ways of reducing the price and/or correctly segmenting the news market such that each pitch can achieve the maximum return for the time invested.

The Price of a pitch

Price in this equation is the Price a receiver of PR pitches pays per story they subsequently produce. Before I expand on this a bit of background. Andrew Smith posted last Friday on the topic of pitching and the frustration journalists experience with activities such as phone calls asking “did you receive my email”, the latest being Charles Arthur at the Guardian.

As well as being a chartered accountant I am also an economics graduate (sad I know) so I thought I would try to provide a Freakonomics like perspective on this issue – hence the equation. (By the way if anyone is as sad as me and wants some more detailed graphs etc relating to this analysis then please just let me know :-) )

Getting your story covered is an issue of supply and demand

Supply – the stories pitched by PRs.

Demand – the journalists, bloggers, editors, publishers and broadcasters need for interesting stories for their readers/audience to help fill column inches, web pages, airtime.

The receivers of news choose to write, talk about or publish- the story and therefore it is they who are making the “purchase”.

The Law of Supply and Demand

In a market supply and demand are brought into equilibrium by the price mechanism.

Suppliers want to supply more product as the price rises. Consumers demand more product as the price falls.

At the equilibrium price (PE), the equilibrium quantity (QE) is produced and consumed ensuring an efficient allocation of resources.

The “Price” of a story is a function of the time invested and interest level

From a receiver of news perspective i.e. editor, journalist etc I would suggest that the Price that the receiver of news is prepared to pay to “purchase” a story is the time I have to spend per story that I talk about or publish i.e. the equation at the start:


Investment of time includes the time it takes to review emails I receive, telephone calls made to me – chasing, pitch or otherwise – and meetings, interviews etc.

News market segmentation

The news market though is not a homogenous one. Not all receivers of pitches have the same level of demand.

(It is also worth noting that demand for PR pitches probably shifts on an almost minute by minute basis depending on the availability of other material for articles, blog posts etc but I think I should leave the concept of elasticity of demand and substitutes for another day!)

In demand journalist (Charles Arthur) scenario

The most in demand journalists are highly likely to be generating articles on their own without needing to rely on PR pitches as much for their material. Consequently their demand for pitches is low and consequently the price they are prepared to pay is low – see graph above.

The PR community on the other hand wants the most in demand journalists to talk about their pitches the most and so these journalists probably get sent the most emails, receive the most calls and yet will use the least stories because their demand is low. The effect being that the PR suppliers are expecting this market segment of consumers to consumer a high quantity of product at a high price.

The result – excess supply of pitches in this market segment.

Market implications

In reality there are multiple demand curves as there are many different types of receivers of news.

The best performing suppliers will either be the ones that are able to lower their prices across the board for all receivers and/or ones who segment the market such that they charge the right price and supply the right quantity in each.

For example a publisher of a niche market website publication who has limited in house resources to produce content may see pitches as a good source of material and therefore be prepared to pay a higher price.

Implications for the PR Industry

So how should PRs (and RealWire) seek to improve the situation for Charles and all the other receivers of releases?

Based on my formula above the Price can be reduced by

– Decreasing the investment required of the receiver
– Increasing the proportion of interesting stories they receive

Decrease investment:

To achieve this you need to do things like:

– Make sure they are as relevant as you can make them
– Ensure that the title tells the story effectively, reducing time to establish interest
– That they are in a format that makes receiving easy e.g. no attachments.
– Give them options for how to receive the pitch e.g. RSS

If you have taken the time to do these things well it is more likely that the recipient will invest the time at least reading the subject header of your email. It is then also a question of tracking usage to see if the recipients of your pitches cover any of your stories and trusting that if you have done these things well you don’t need to call everytime.

Effect? Reduced investment on the part of the recipient through reduced emails, less time to establish interest in the story and reduced phone calls.

Increase proportion of interesting stories:

This is clearly a trickier area as a lot is about message, creativity and having compelling stories to tell. I won’t get into what makes for a newsworthy story here as others could cover that far better than I.

However there are other ways of increasing the interest in your story such as using multimedia content – images, audio, video – including links to relevant websites for further information, and including background documents such as technical specifications.

Conclusion

The provision of pitches by the PR Industry to the receivers of news would appear to suffer from a significant level of inefficiency in the allocation of resources. This is due to PR suppliers charging too high a price for a given level of demand. Over supply to the most in demand journalists leads to frustration for them, and a lack of productivity and efficiency on the part of the PRs, causing reduced profitability.

To improve this situation the industry needs to invest, either internally or via external suppliers, in ways of reducing the price and/or correctly segmenting the news market such that each pitch can achieve the maximum return for the time invested.