 Analysis of the Twitter chat around the UK General Election 7 way #leadersdebate suggests that Twitter’s influence on the outcome may not be because of it’s role as a conversation and engagement platform.
It could primarily be due to the highly effective broadcasting and amplification activities of small groups of partisan individuals, combined with the subsequent reporting by the UK media of simplistic volume based analysis.
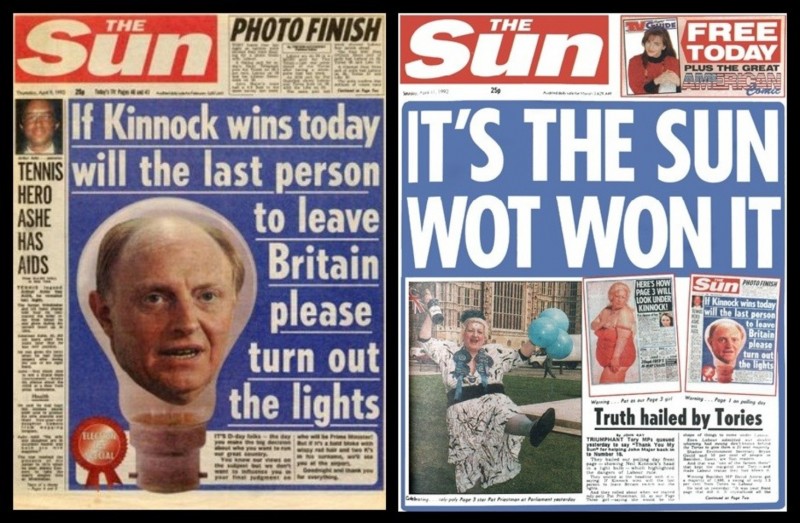
The 2015 UK General Election is being called the “social media election”. Twitter’s importance has been compared to The Sun newspaper’s claimed impact on the 1992 result. In fact, this comparison was also drawn in 2010.
With this in mind you can’t move for social listening platforms and the media, talking about Twitter data and what it represents: graphs of mentions of leaders and parties abound.
Some have even suggested Twitter data might be able to predict the result.
The problem is, the analysis I’ve seen to date is so simplistic it risks being seriously misleading.
Demographics
There are multiple reasons why you have to be very careful when using Twitter data to look at something as complex as the Election. I tweeted the other day that demographics is one of them.
Demographics is just one reason why Twitter data needs treating VERY carefully if using to “predict” #ukelection 2015 pic.twitter.com/fAmKlY2WZq
— Adam Parker (@AdParker) March 23, 2015
Twitter is skewed towards younger people who are only a minority of those who will vote – and a significant number, 13 per cent, can’t vote at all.
This is valuable insight when it comes to targeting 18-34 year old potential young voters and trying to engage them politically e.g. for voter registration.
But it also shows that in a listening, or reaction context, Twitter’s user base is wholly unrepresentative of the UK voting population.
And there’s a potentially bigger issue with taking Twitter data at face value – vested interests.
#Leadersdebate
One of the first major examples of social media analysis that received widespread coverage was in relation to the seven way #leadersdebate. 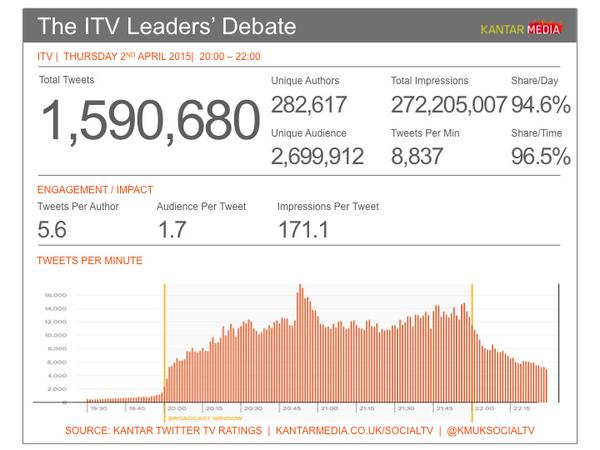 Many analytics vendors analysed the volume of mentions of leaders or parties, to try and provide insight into who “won”.
 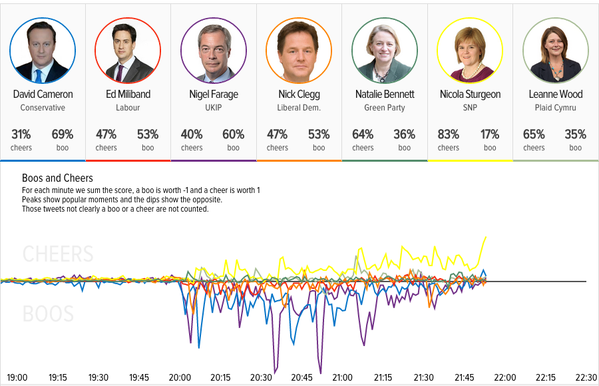 What they didn’t do was question the motivations of those who participated in the Twitter conversation.
GB Political Twitterati
To investigate this I used Lissted to build communities for each of the seven parties represented in the debate – Conservatives, Labour, Liberal Democrats, SNP, Greens, UKIP and Plaid Cymru.
These communities comprise obvious users such as MPs and party accounts, as well as accounts that Lissted would predict are most likely to have a strong affiliation with that party based on their Twitter relationships and interactions.
They also include media, journalists and other commentators whose prominence suggests they are likely to be key UK political influencers, and a handful of celebrities were in there too.
We’ll call this group of accounts the “Political Twitterati”.
The group contained 31,725 unique accounts[1] that appeared in at least one of the seven communities. This number represents only 0.2 per cent of the UK’s active Twitter users[2].
I then analysed 1.27 million of the tweets between 8pm and 11pm on the night of the debate that used the #leadersdebate hashtag, or mentioned some terms relating to the debate.
Within this data I looked for tweets either by the Political Twitterati, or retweets of them by others.
Findings about the Political Twitterati
- 25x more likely to get involved in the conversation [3]
So we know they were motivated.
- Accounted for 50 per cent of the conversation [4]
So they were highly influential over the conversation as a whole.
- Included 69 per cent of the top 1,000 participants [5]
So the vast majority of the key voices could have been predicted in advance.
Analysis by Political Affiliation
I then broke the Twitterati into four groups.
– Journalists, media, celebrities and other key commentators who generally appeared in multiple communities
– Directly related to a party e.g. MPs, MSPs, MEPs or accounts run by the parties themselves
– Accounts with a strong apparent affiliation to one party because they only appeared in one of the communities
– Other accounts with mixed affiliation
Here’s a summary of their respective activity:
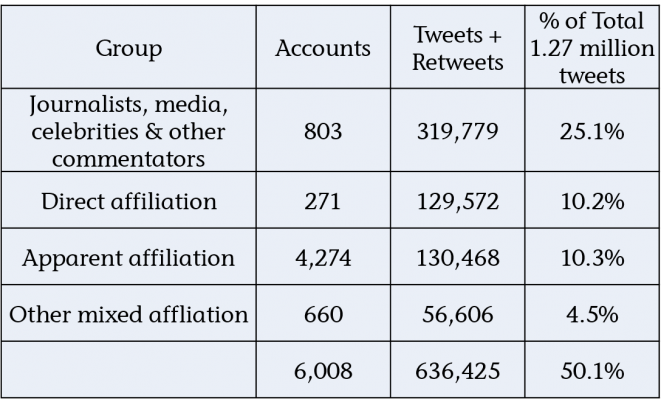
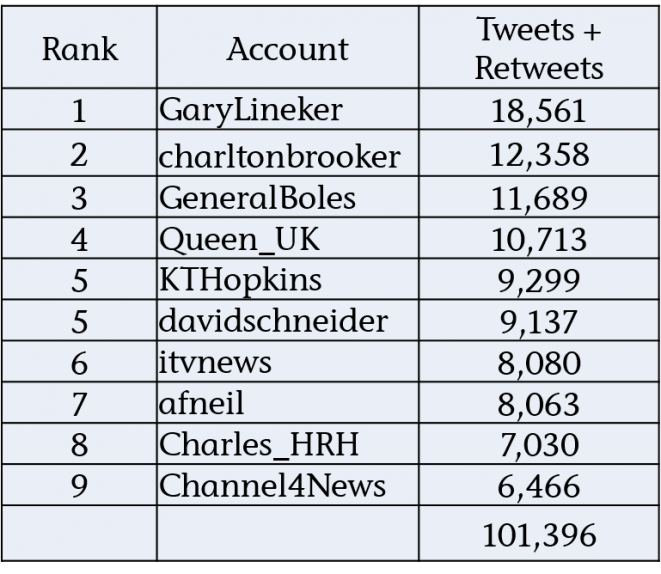
We can see that one in four tweets were generated by only 803 journalists, media, celebrities or other commentators.
The top ten of which were these:
We can also see that one in five tweets were generated by accounts that had a direct[6] or apparent political affiliation[7].
If we break these down by party we get this analysis of politically affiliated reaction:
The numbers demonstrate how Labour and the SNP are able to shift the Twitter needle significantly through just a small number of participants.
The SNP’s performance is particularly impressive with only 801 accounts generating almost 5 per cent of the whole conversation.
An example of tactics
So how do they do this? Well here are some examples of how the SNP community amplifies positive remarks made by (I think) non affiliated Twitter users.
The following are all tweets by users with less than 40 followers, who rarely get more than the odd retweet, but who in these cases got 50 or more out the blue. Can you guess why?
I wish I could vote for Nicola Sturgeon! #leadersdebate — Chloe (@chlojojojo) April 2, 2015
So, after all that, I want to vote SNP; unfortunately they’re not fielding any candidates in England. #leadersdebate
— Chris Goddard (@MagpieSupernova) April 2, 2015
I’m off to Scotland so I can vote SNP #leadersdebate
— Mole (@OoberMole) April 2, 2015
I’d like to vote SNP/Plaid but I live in England! #leadersdebate — Garry Lucas (@GarryLucas1) April 2, 2015
Kinda wish I was Scottish. Would totally vote for Sturgeon. #leadersdebate — Mizukian (@mizukian) April 2, 2015
I live 600 miles from Scotland but want to vote for @NicolaSturgeon damn she knocked them all dead #leadersdebate — Gaynor Riley (@rilgay) April 2, 2015
What you find when you look at the retweets in each case is that many are coming from accounts that would appear to have a SNP affiliation.
In fact look closer and you find that a number of the 779 affiliated accounts[7] appear.
Unsurprisingly, given the reputation of the SNP community for being very active and organised online, they were looking out for positive tweets about their party or their leader, and then amplifying them.
Conclusion
Simplistic analysis of Twitter data around a topic like the General Election has the potential to be at the least flawed and at worst genuinely misleading.
Not only are the demographics unrepresentative of the voting population, but the actions of small groups of motivated individuals are capable of shifting the needle significantly where simple volume measures are concerned.
The resulting distorted view is then reported at face value by the media, creating a perception in the wider public’s mind that these views are widely held.
Of the seven parties it would appear that what they learned during the Scottish Referendum is standing the SNP community in good stead when it comes to competing for this share of apparent Twitter voice.
So Twitter may indeed end up being “wot won it”, but potentially not because of general public reaction, engagement and debate, but because of highly effective broadcasting and amplification by a relatively small, but motivated group of individuals, and the naive social media analysis that is then reported by the media.
Notes:
1. Lissted can decide how many accounts to include in a community list based on a threshold of the strength of someone’s relationships with a community. The lower the threshold, the weaker the ties, and arguably the weaker the affiliation.
2. Based on 15 million UK active Twitter users.
3. 6,008 of the Political Twitterati accounts appeared at least once. That’s around one in five (6,008 out of 31,725).
119,645 unique users appeared in the data sample as a whole. Based on 15 million active UK Twitter users that’s around 1 in 125.
Suggesting this group of relevant accounts was 25 times more likely to have participated in the conversation than your average Twitter user.
Even if we take the figures based on Kantar’s wider sample above of 282,000 unique users the resulting ratio of 1 in 53 gives a figure of 10x more likely.
4. These 6,008 accounts tweeted 50,461 times. These tweets were then retweeted 585,964 times meaning they accounted for 636,425 of the tweets or 50.1%.
5. Looking at the top accounts that generated the most tweets and retweets in the data gives the following:
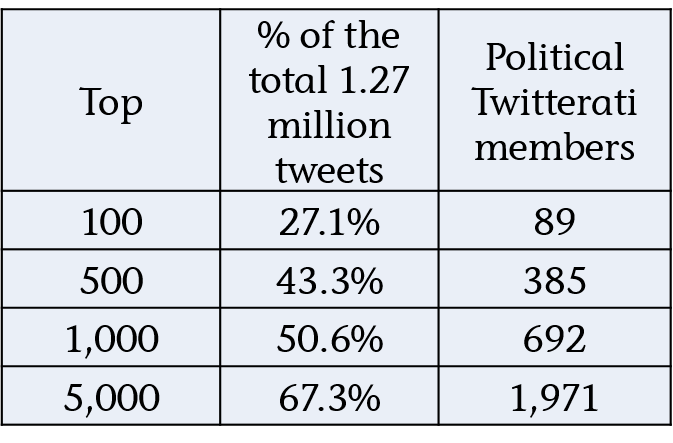 The top 1,000 accounts generated over half of the tweets (50.6%) either directly or through retweets. 692 of these accounts appear in our Twitterati list.
6. Direct accounts
These are accounts directly affiliated with a party e.g. MPs, MSPs, MEPs or accounts run by the parties themselves.
Breaking these down across their political affiliations we get the following:
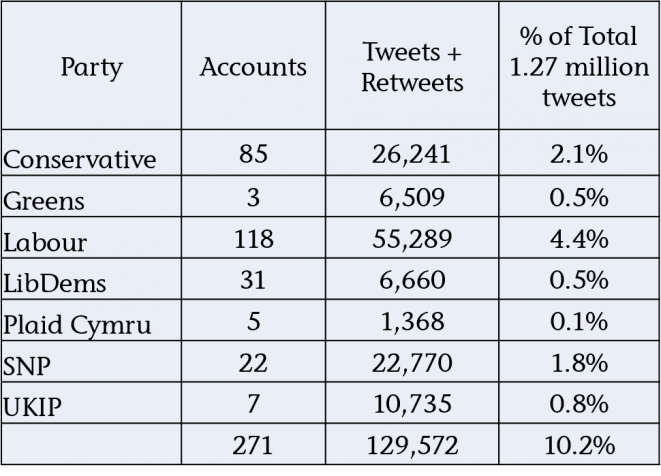
So this handful of 271 clearly biased individual accounts, were ultimately responsible for 10 per cent of the total tweets.
How likely do we think it is that people retweeting these party affiliated accounts were undecided voters?
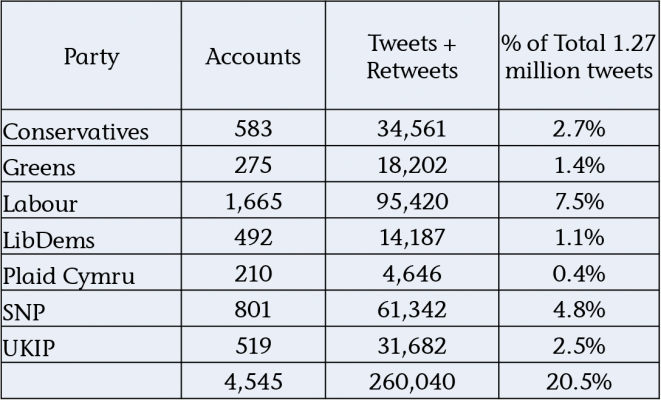
7. Apparent affiliated accounts
At the other end of the scale there are the accounts that only appear in one of the communities.This suggests that these individuals have a very strong affiliation to one party and will equally be partisan.
Within the 6,008 Twitterati accounts that participated were 4,274 that only appear in one of the seven communities (and weren’t included in the media/celebrity group).
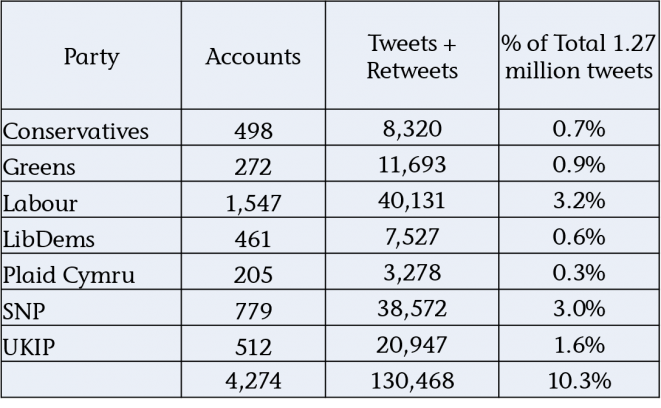
Between them these 4,274 users again accounted for 10 per cent of the total conversation.
The Labour party group comes out top with 3.2 per cent of the total tweets, but it’s the SNP group of 779 accounts, contributing 3.0 per cent, or one in thirty three of all tweets, that massively punches its weight in this group.