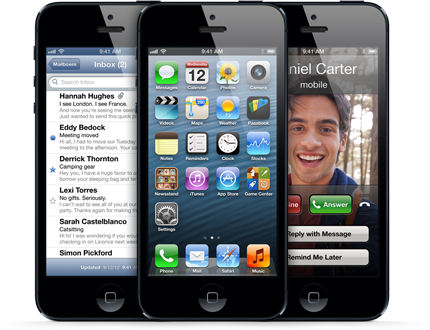
Apple’s iPhone 5 pre order sales record is only an “as expected”

iphone 5

“Apple today announced pre-orders of its iPhone 5 topped two million in just 24 hours, more than double the previous record of one million held by iPhone 4S”

That’s a quote from Apple’s announcement yesterday about how excited they were with customers’ reaction to the launch of the iPhone 5 following a mixed reaction from the media (something we analysed with our new Lissted application last week).

2m in 24 hours sounds very impressive, and it is in absolute terms.

But all things are relative and when you put this number in context it loses its shine a little. To do this we need some data and a couple of assumptions.

Data

The table at the bottom of this post shows quarterly sales volumes of iPhones since the product was launched. These have been extracted from Apple’s quarterly results from Q/E 30/6/2007 – Q/E 30/6/2012 (hat-tip to @latestgadgetsuk for pointing me in the right direction). These show that total iPhone sales in this 5 year period have been 244.16m.

Assumptions

1. That on average iPhone owners upgrade their phones every 18 months. In reality it will probably be a mix of die hards changing every new model and less ardent fans perhaps changing every two models, with some in-between.

2. That it is only existing iPhone owners who have pre-ordered the iPhone 5. This won’t be the case, there’s bound to be some new converts in there, but if so this would only make my conclusion stronger.

iPhone 5 pre order analysis

On this basis then on average people who bought their iPhone 18 months ago would be looking to upgrade about now. Looking at the table below that means the Q/E 26/3/2011. Apple sold 18.65m phones in this quarter. That’s approx. 200,000 per day.

Given Apple effectively announced the iPhone 5 on the 4th September by their invite I seriously doubt many people went out and upgraded their iPhone 4 to a 4S in this period. In which case by the time pre orders opened on 14th September there would be (on average) 10 days of pent up demand for upgrades. 10 days @ 200,000 per day = 2m.

In other words the number of pre orders is equal to the number of upgrades you would have expected given the number of iPhone owners, likely upgrade cycle and the 10 day fallow sales period that the invite probably caused.

iPhone 4S pre order analysis

And what about the comparison to the iPhone 4S previous record of 1m that it “shattered”. In this case we need to look at the Q/E 27/3/2010 to find the likely upgraders.

Apple sold 8.75m phones in that quarter. That’s approx. 100,000 per day. Invites to the launch went out on the 27th September 2011 and pre orders started on 7th October 2011 – 10 days again. 10 x 100,000 is……you guessed it 1m.

So the level and growth in pre orders arguably represents nothing more than existing customers upgrading at expected levels and the growth in the iPhone ownership base since the 4S was launched.

So watch out whenever the iPhone 6 comes out. If Apple wants to “shatter” the pre-order record again you might just see those invites going out a week earlier!

Apple iPhone unit sales (millions)
Quarter Sales
Q/E 30/6/2007 0.27
Q/E 29/9/2007 1.12
Q/E 29/12/2007 2.32
Q/E 29/3/2008 1.70
Q/E 28/6/2008 0.72
Q/E 27/9/2008 6.89
Q/E 27/12/2008 4.36
Q/E 28/3/2009 3.79
Q/E 27/6/2009 5.20
Q/E 26/9/2009 7.40
Q/E 26/12/2009 8.70
Q/E 27/3/2010 8.75
Q/E 26/6/2010 8.40
Q/E 25/9/2010 14.10
Q/E 25/12/2010 16.24
Q/E 26/3/2011 18.65
Q/E 25/6/2011 20.34
Q/E 24/9/2011 17.07
Q/E 31/12/2011 37.04
Q/E 31/3/2012 35.10
Q/E 30/6/2012 26.00
244.16

Apple’s brand not core to its success

Interbrand published their list of the top 100 global brands for 2009 last week, Coca Cola maintaining its position at the top for the ninth year in a row. I thought it would be interesting to compare the brand values calculated by Interbrand with the equity values of the companies concerned as it would indicate those companies with the most to lose (and gain) through their PR and reputation management.

The results for some companies are surprising including the banks, JP Morgan and HBSC, and in particular Apple, who it seems is not very reliant on its brand with only 9% of its company valuation represented by its brand value.

Interbrand’s  methodology effectively values the extent to which a brand is able to generate financial benefits due to the superior demand created through the strength of the brand itself and not the underlying assets, expertise etc of the company.

Comparing this brand value with the company’s stock market value effectively gives an assessment of the extent to which the brand itself is the driver of the company’s performance.

The table below shows the top 50 brands in the Interbrand list sorted in descending order by those whose brands represent the highest proportion of their company valuation. (The position figure is their position in the Interbrand list).

Top of this list is the French company PPR who own the Gucci Group and Puma amongst others. These two brands alone are valued by Interbrand at $11.4bn compared to a stock market value today for PPR of $16.1bn (£11bn) i.e. 71% of the company valuation is accounted for by the brand value of these two brands. Another luxury brand that appears high in the list, with 53% of its value accounted for by its two biggest brands, is Louis Vuitton Moet Hennessy.  This doesn’t seem surprising given the importance of brand in establishing luxury items’ worth.

Bottom of the list are the banks JP Morgan and HBSC. Only 5% of their company valuations is accounted for by their brand values. However this is not a credit crunch effect as this figure has not changed much over the last two years. This seems a little strange to me on the face of it as it implies that the banking sector is much more of a commodity market despite the importance of trust and confidence in this sector.

But more surprising still is Apple. According to Interbrand only 9% ($15.4bn) of the company’s value ($165.7bn) is accounted for by its brand. This compares to 25% for Microsoft and 42% for Sony. This implies that Apple’s brand is not considered an important driver of value in the company and yet I would suspect that most communications and marketing people would perceive that the opposite was the case.

I wonder if the majority of the reason why Apple is valued at 32 times its earnings (as of 21/9/09) driven by high expectations of its ability to innovate and design new products now and into the future and not the Apple brand itself?

Anyone else have any theories?

Position in Survey Company Ticker

Brand value
$bn

Equity value
$bn
Brand value as % of equity value
41 Gucci/Puma (PPR) PP:PAR 11.4 16.1 71%
15 BMW BMWX:GER 21.7 32.3 67%
5 Nokia NOK 34.9 57.8 60%
48 Heinz HNZ 7.2 12.5 58%
34 Kelloggs K 10.4 18.7 56%
1 Coca Cola KO 68.7 124.6 55%
10 Disney DIS 28.5 52.9 54%
16 Louis Vuitton/Moet (LVMH) MC:PAR 24.9 47.3 53%
6 McDonalds MCD 32.3 62.2 52%
12 Mercedes Benz (Daimler AG) DAI 23.9 49.9 48%
26 Nike NKE 13.2 28.5 46%
29 Sony SNE 12.0 28.4 42%
2 IBM IBM 60.2 160.1 38%
22 American Express AXP 15.0 41.3 36%
42 Phillips PHG 8.1 23.4 35%
35 Dell DELL 10.3 32.6 32%
21 H&M HMB:STO 15.4 49.2 31%
49 Ford F 7.0 22.4 31%
45 Accenture ACN:NYQ 7.7 25.6 30%
18 Honda HMC 16.8 55.9 30%
40 Thomson Reuters TRI 8.4 28.3 30%
9 Intel INTC 30.6 109.5 28%
4 General Electric GE 47.8 175.3 27%
39 Nintendo 7974:TYO 9.2 33.9 27%
3 Microsoft MSFT 56.6 225.1 25%
8 Toyota TM 31.3 130.5 24%
46 Ebay EBAY 7.4 31.4 24%
11 HP HPQ 24.1 109.4 22%
36 Citibank C 10.3 48.3 21%
33 Canon CAJ 10.4 49.3 21%
19 Samsung A005930:KSC 17.5 85.1 21%
7 Google GOOG 32.0 155.6 21%
27 SAP SAPX 12.1 59.3 20%
17 Marlboro (Philip Morris) PM 19.0 93.2 20%
43 Amazon AMZN 7.9 39.0 20%
31 UPS UPS 11.6 58.4 20%
50 Zara (Inditex) ITX:MCE 6.8 36.5 19%
14 Cisco CSCO 22.0 135.5 16%
30 Budweiser (AB InBev) AHBIF 11.8 73.9 16%
13 Gillette/Duracell (Procter and Gamble) PG 26.4 167.3 16%
23 Pepsi PEP 13.7 93.3 15%
44 Loreal OR:PAR 7.7 57.2 13%
24 Oracle ORCL 13.7 108.4 13%
38 Goldman Sachs GS 9.3 93.7 10%
20 Apple AAPL 15.4 165.7 9%
47 Siemens SI 7.3 84.4 9%
25 Nescafe (Nestle) NESN:VTX 13.3 154.2 9%
37 JP Morgan JPM 9.6 176.8 5%
32 HSBC HCS 10.5 204.8 5%
28 IKEA 12.0
Total 945.3 3925.0 24%
IKEA figures not calculated as privately owned so no stock market valuation available
Equity valuations were as of 21st September 2009
Tickers refer to New York Stock Exchange except where stated
Where currencies have been translated the following rates to $1 were used:
Euro = 0.682
Yen = 92
Korean Won = 1,204
Canadian $ = 1.077
Swiss Franc = 1.04