Next Fifteen outperforming the market

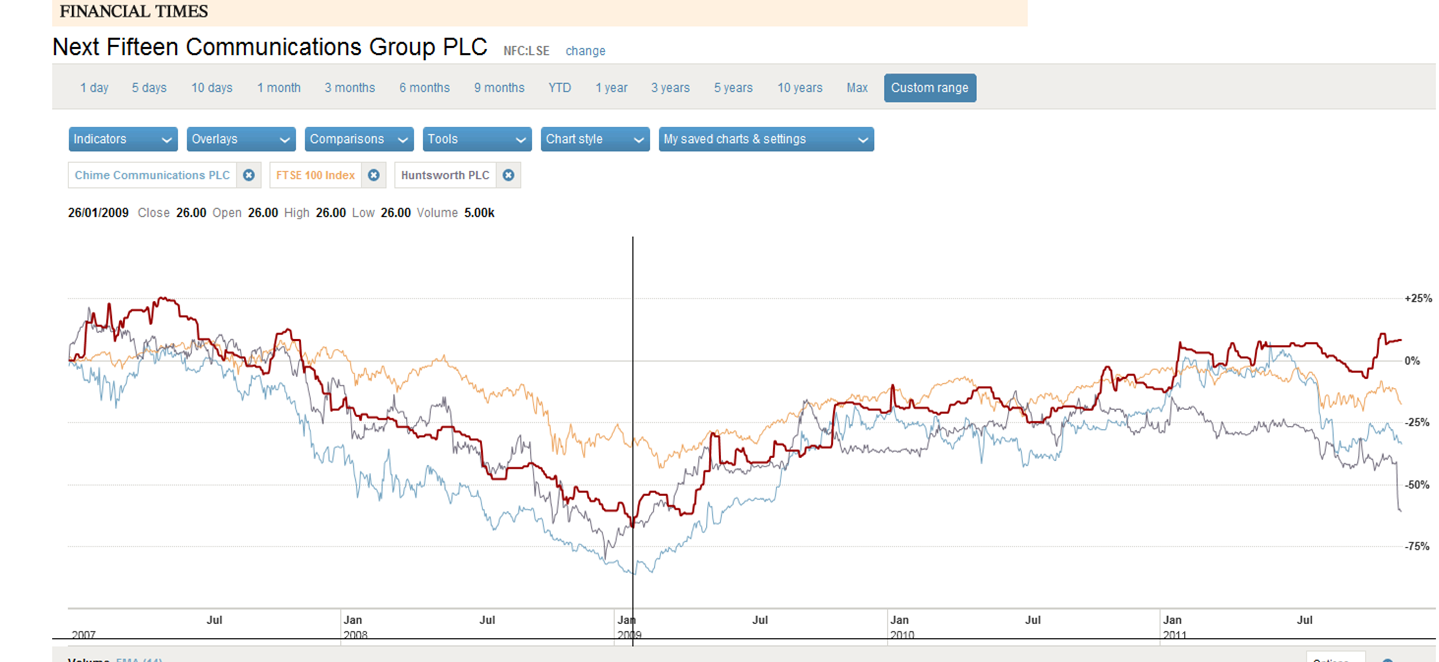
Click on image for larger version of graph

Next Fifteen SharePriceThere’s been a lot of talk in the last couple of weeks about PR finding it tough. Chime Communications and Huntsworth have both announced that their 2011 results are likely to be affected by the apparent slowdown in economic activity.

It isn’t just PR that’s finding things tough. Huntsworth is a PR group, but its worth remembering that only approx 50% of Chime’s revenues (though 60% of its profits) come from PR, the remainder from other marketing services and the share prices of the major multinational Marcoms groups have also taken a bit of a battering over the last few months.

As of 28/11/11 (16.50) some examples of these reductions from their 52 weeks highs are – WPP (-25.3%), Omnicom (-19.2%), Interpublic (-33.5%), Havas (-32.0%), Aegis (-29.6%) and Publicis (-19.8%).

This contrasts with the FTSE100 which was down around 13% against its 52 week high the same time this afternoon. Not that surprising as Marcoms usually underperforms in falling markets and overperforms in rising ones.

But as the graph above shows one quoted PR company has been bucking the trend. Next Fifteen is actually trading at a higher level than it was at the start of 2007 something none of the others can claim except for Publicis.

Next Fifteen is also the only one of these PR or Marcoms groups whose share price is up in calendar year 2011 (15%). Now obviously Next Fifteen is significantly smaller (market capitalisation £49m) than even Huntsworth (£90m) and Chime (£148m), nevermind the multinational groups but that doesn’t mean that outperforming the market is therefore easier.

In the Evening Standard a couple of weeks ago Tim Dyson, Next Fifteen’s CEO, put their success down to investment in digital and social media. In the analysis of the PR industry for 2010 that I helped the Holmes Report put together earlier this year the biggest success story was Edelman, (arguably) the first of the major PR brands to embrace digital, which climbed to the No.1 spot in the Holmes Report Global Rankings.

So perhaps this evidence demonstrates that though we can almost certainly expect another challenging year in 2012, there is still success to be found and particularly for those elements of the PR industry that are making digital core to their business.

UK PR Agency/Freelance market £2bn according to PRWeek/PRCA Census

PRWeek and the PRCA announced the results of their PR Census a few weeks ago now. One of the key headline numbers was their estimated turnover of the UK PR Industry – £7.5bn.

I wanted to clarify how this number was reached and Cathy Bussey at PRWeek was kind enough to put me in touch with the senior researcher at Harris Interactive who put together the analysis.

He was most helpful and from our discussions I established that the £7.5bn represents the estimate of the total amount spent on PR both in house and with external agencies and freelancers.

UK PR Industry PR Census split

The split between in house and advisory is:

In House – £5.5bn
Agency/Freelancers – £2.0bn

The estimates were reached through the use of a combination of data including census returns, Office of National Statistics Data and the PRWeek Top150. With regards to the Agency/freelancer market figure of £2bn my view is that it is probably at the higher end of the likely range of estimates (as I will indicate below), but from my discussions the methodology behind it seems reasonable.

On the face of it two immediate implications are apparent. The vast majority of PR is delivered from in house resources (73 per cent of the total) and the agency/freelance market is highly fragmented.

The “highly fragmented” implication being due to the PRWeek Top 150 agencies with a combined income of £839m accounting for 42 per cent of the total UK agency/freelance market with no one agency in the Top 150 accounting for more than 3.3 per cent of the total market – Bell Pottinger – and even they are arguably a collection of agencies under one umbrella.

However these conclusions would represent an over simplification of the market.

Many Markets

When people talk about “the housing market” I often sigh because such a thing doesn’t really exist. In reality there are a lot of micro markets dependent on type of property and geography, even down to street level in some cases. In a similar way, as any agency MD/owner would tell you, the PR advisory market isn’t one homogenous beast.

At a very basic level it breaks into two main areas:

1. The small number of larger agencies almost exclusively based in the London Metro area competing for the accounts of large, often multinational, companies in the main where breadth of service areas, international capability and established brand can often be hygiene factors. These large companies will almost always have significant in house PR capability compared to SME’s meaning that external PR spend as a proportion of in house spend in this large company market will probably be quite a bit lower than the overall 27 per cent figure. Competition is therefore still very high despite the small number of participants as clients in house capability means they still hold the majority of the cards.

2. The remainder of the market where a very high volume of participants compete in individual micro markets driven by geography, sector and/or service area. In these markets the purchasers of external support will generally have much lower levels of in house PR capability (potentially none) and so the spend on PR will almost certainly represent a much higher proportion of total spend than the 27 per cent average. This can lead to these clients relying more heavily on their PR advisers, though this is very dependent on the particular micro market and how differentiated an individual agency/freelancer is in that market.

The £2bn overall estimate gives us a basis to estimate the potential split between these two broad market areas and equally these definitions provide a framework to test the reasonableness of the £2bn estimate itself.

Large Company Market

Firstly on the large company side we can look to establish a likely cut off point in agency size terms based on market share.

A bit of additional analysis on the PRWeek Top150 relating to the holding companies of agencies establishes the following list of 16 groups or individual agencies who would have market share of 0.5 per cent or more if the total UK agency/freelance PR market is £2bn. (Note many of these numbers are estimated by PRWeek within the Top 150 as the agencies don’t provide specific numbers – full details here)

Revised position Company Income £’000 UK Market %
1 WPP agencies¹ 91,600 4.6%
2 Bell Pottinger Group 67,818 3.4%
3 Omnicom agencies² 57,500 2.9%
4 Huntsworth agencies³ 55,663 2.8%
5 Brunswick 53,200 2.7%
6 Interpublic agencies4 37,500 1.9%
7 FD 31,000 1.6%
8 Edelman 28,777 1.4%
9 Freud Communications 23,800 1.2%
10 Engine Group 22,252 1.1%
11 MS&L Group 20,000 1.0%
12 College Hill 16,730 0.8%
13 Havas agencies5 14,500 0.7%
14 Photon agencies6 13,330 0.7%
15 Next Fifteen agencies7 11,858 0.6%
16 Chandler Chicco Companies 10,602 0.5%
Total 556,130 27.8%

See Notes below for agencies within each group.

This analysis makes WPP the single largest player in the UK PR market with 4.6 per cent of the market.

Obviously agencies (and freelancers) that are smaller than the £10m (0.5 per cent) cut off I have used above can still often win work with large companies, particularly if they have an area of clear differentiation either around sector or service specialism. If you include agencies with income of greater than £3m (0.15 per cent of the total market) from the PRWeek 150 table these would add an additional £144m between them giving £700m in total.

Two other factors need to be taken account of to reach our estimate of the large company market. Firstly not all sizeable agencies are in the Top 150 (though the vast majority are) and in addition there will be some PR services being provided to large companies by teams within agencies of other types e.g. digital marketing, SEO and social media. (Equally it is worth bearing in mind that some of the PR agencies concerned could be providing some marketing and SEO services within their own figures). As a complete finger in the air estimate to compensate for this if we make an allowance of £100m this would imply that the large company market is approx £800m in total.

For information if we now restate the table above based on an estimate of £800m for the large company market you get the following market share figures for the largest groups/agencies in this market:

Revised position Company Income £’000 UK Large Co. Market %
1 WPP agencies 91,600 11.5%
2 Bell Pottinger Group 67,818 8.5%
3 Omnicom agencies 57,500 7.2%
4 Huntsworth agencies 55,663 7.0%
5 Brunswick 53,200 6.7%
6 Interpublic agencies 37,500 4.7%
7 FD 31,000 3.9%
8 Edelman 28,777 3.6%
9 Freud Communications 23,800 3.0%
10 Engine Group 22,252 2.8%
11 MS&L Group 20,000 2.5%
12 College Hill 16,730 2.1%
13 Havas agencies 14,500 1.8%
14 Photon agencies 13,330 1.7%
15 Next Fifteen agencies 11,858 1.5%
16 Chandler Chicco Companies 10,602 1.3%
556,130 69.5%

These figures suggest that this large company market is actually quite concentrated when you take account of holding company groups with the top 10 accounting for almost 60 per cent.

Micro markets

The large company estimate of £800m would leave approx £1.2bn of the £2bn overall which would then relate to the second category of micro markets.

Ignoring sector or service specialism and just focussing on geography within these micro markets then the largest of them unsurprisingly is the London Metro area with the remaining PRWeek Top 150 entrants with income of less than £3m predominantly still based here – £109m out of £139m or 79%.

The unknown factor here is what proportion of the London Metro area market do these agencies account for? If for arguments sake we said it was half then this would give an estimate for this micro market of approx £200m+.

This would mean the large company market (mainly serviced from within London Metro) and the smaller company London Metro markets would be approximately £1bn combined. In turn implying the remaining micro markets for the rest of the UK would then account for approx £1bn.

(Interesting to note that the London Metro region accounts for an estimated 30 per cent of UK GDP and yet apparently at least 50 per cent of UK PR activity)

It is this implied figure for the regions of £1bn that leads me to think that the overall £2bn estimate may be on the high side. Evidence for this comes from the PRWeek Regional agencies rankings.

Regional element

Manchester based agencies have the largest combined income in the PR Week regional list with £12.2m and no other city represented on the list has more than £10m. There are 17 cities in the UK outside of the London Metro area with populations of more than 250,000 the average of which is 427,000. The following table shows their population and the combined income total of PR agencies in the Top 40 Regional List that are based there.

City

Population

Combined Regional Top 40 value £’m

Birmingham

992000

4.4
Leeds

720000

3.5
Glasgow

560000

7.3
Sheffield

512000

Bradford

467000

Edinburgh

450000

4.4
Liverpool

440000

0.8
Manchester

420000

12.1
Bristol

380000

1.7
Wakefield

316000

Cardiff

310000

9.0
Coventry

305000

0.8
Nottingham

285000

Leicester

280000

Sunderland

280000

Belfast

280000

Newcastle upon Tyne

259000

0.9

These regional markets may be highly fragmented and freelancers may account for a much higher proportion of PR services in these areas. It also seems likely that a lot more PR services may be provided by agencies/freelancers who would have a broader marketing remit and so wouldn’t fall under the definition of “PR agency”. Consequenty these ranked agencies may only account for a relatively small proportion of the PR services provided in their area. However given the regional rankings it still seems unlikely that even the largest of these regional markets is measured in more than tens of millions. For the purpose of this exercise if we therefore assume the market size for the average of these cities is £25m you would get a total estimate for these larger regional markets of £425m.

This would give a total for large companies, London Metro and the main regional centres of approx £1.4bn. With the remainder of the country being likely to be fairly limited in market size terms it does seem that the £2bn overall figure looks a bit of a stretch. This analysis suggests an overall estimate of £1.6bn might be nearer.

On the other hand the analysis could be understating the large company market (is £100m enough for missing entrants in the PRWeek 150 and other types of agency?), the smaller company London Metro market could be substantially more than £200m (do the PRWeek entrants count for less than 50 per cent?) and perhaps the regional agencies really do only account for a very small proportion of their local markets.

Without detailed returns from everyone this is always going to be a difficult task and the research for the PRWeek/PRCA Census was certainly thorough so perhaps we can agree that a figure of £1.8bn +/- 10% is a fair range.

Notes

Agency groups

1. Finsbury, Hill and Knowlton, Ogilvy Health, Cohn & Wolfe, Burston Marsteller, Buchanan, Ogilvy, Clarion Comms
2. Ketchum Pleon, Fleishman Hillard, Fishburn Hedges, Porter Novelli, Kreab Gavin Anderson
3. Grayling, Citigate, Red, Tonic Life
4. Weber Shandwick, Golin Harris
5. EuroRSCG and Maitland
6. Frank, Hotwire
7. Lexis, Bite
PR Week Top 150 2010 – 0.75 per cent up or 10 per cent down?

0_300_300_http---offlinehbpl.hbpl.co.uk-misc-ORP-PromoItemsRight3-Top150_2010ButtonPR Week published its 2010 league table of the Top 150 PR agencies in the UK last week. The main headline was that overall the agency market was estimated to have grown by 0.75 per cent during 2009.
As comforting as this figure might be to all of us working in, or with, the PR industry my own take on the figures suggests that the picture may not have been quite so rosy.  I estimate that a reduction of around 5-10 per cent is probably a more realistic range and is more consistent with David Brain’s analysis yesterday from a global perspective.

This conclusion is based on an analysis of the changing make up of the table and other supporting evidence.

For clarity PR Week’s 2010 league table is based on income generated in calendar year 2009. Similarly the 2009 league table is based on income generated in calendar year 2008.

Analysis of the league table positions

The table below shows the income that an agency had to achieve in each of the last two years in order to be ranked at the particular positions shown in the league table;

Position

2008 income £’m
(2009 League Table)

2009 income £’m
(2010 League Table)

Change

10th

18.92

16.49

-12.8%

25th

8.35

7.52

-9.9%

50th

4.79

4.10

-14.4%

75th

2.87

2.64

-8.0%

100th

1.80

1.63

-9.4%

150th

1.14

0.44

-61.4%

The table shows that to achieve a particular position in 2010 requires significantly less income at all levels compared to the 2009 league table. For instance to be ranked 25th in the table this year required an income of £7.52m, but to achieve the same position last year require £8.35m, a 9.9 per cent reduction.

Excluding the change at the 150th position the reductions are between 8.0 and 14.4 per cent with an average of 10.9 per cent.

In producing this table I have made adjustments for new entrants and mergers to make it more accurate:

2010 New entrants

Of the agencies that were new entrants into the Top 150 this year six of them would have been included in last years list had they submitted their figures. I have added these into 2009’s list for consistency.

Mergers

The numbers are also affected by the mergers of Grayling/Trimedia, Ketchum/Pleon and Tonic/Huntsworth Health. In these cases I have also combined the income for the three combinations in 2009’s list as well in order to compare like with like.

Other evidence that doesn’t fit with the headline estimate

Agencies joining and leaving the list – is it a fully representative sample?

It would appear that Stephen Waddington’s challenge to the industry to submit their numbers for the benefit of all has gone unanswered by some. 30 agencies (excluding those that have merged) that were in the top 150 last year do not appear in the 2010 league table.

Between them these agencies had total income in 2008 of £67.2m and varied in size between £13.80m and £1.13m. Given that the 150th position agency in the 2010 league table has income of £0.44m these agencies would have needed to have suffered a reduction in income of between 61 per cent and 97 per cent to have not made the cut.

This seems highly unlikely and what I suspect is more likely is that these agencies just didn’t submit figures this year. Obviously individual agencies could have any number of reasons why they chose not to, or were unable to, submit figures. However the absence of 20 per cent of last year’s list begs the question as to whether relying on just those who have submitted represents a valid sample. Have some agencies chosen not to submit numbers for fear of how they might look? Is the table therefore more likely to be biased towards those that performed better?

It is impossible to calculate a sensible estimate of the impact of these absences, but it does seem reasonable to question whether the sample, that the 0.75 per cent growth figure was based on, is truly representative.

Performance of the major Marcoms groups PR brands

The major global Marcoms groups that publish figures for PR specifically performed as follows in 2009:

Like for Like change in income

WPP

-7.4%

Interpublic

-4.5%

Omnicom

-10.6%

WPP is organic change from 2009 analyst report
Interpublic from PR Week article 17 March 2010
Omnicom is organic change from 2009 analyst report

It is obviously possible that the UK elements of these businesses performed better than the rest of the world. However given that the UK recession was amongst the longest and deepest and in the absence of any specific data to the contrary, I would take these figures as they stand.

Between them these three groups account for approximately £2bn in PR revenues worldwide and these figures would also indicate a reduction of approximately 5-10 per cent.

Conclusion

It was clearly going to be a challenge for PR Week to pull together a robust analysis this year due to the optional submission nature of the list. However I think there is significant evidence to suggest that the headline performance of slight growth is more than a little misleading.

But what do agency heads think? Is my estimate of minus 5-10 per cent nearer the mark?

PR Industry beating the market in 2009 and then some

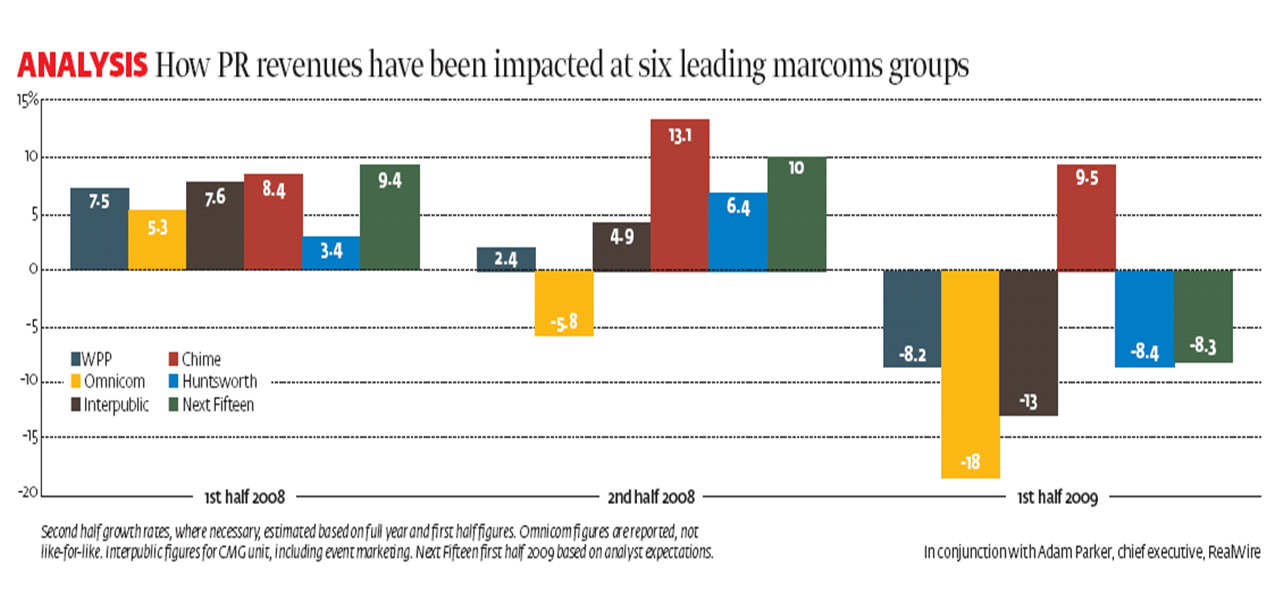
I helped PRWeek pull together some analysis last week of the results of the PR elements of some key Marcoms groups. The results can be seen in the graph below (you will need to access the original file to see clearly. Notes at the end of this post re: sources and basis of data). What the graph very clearly shows is the (unsurprising) turnaround in fortunes of these groups from generally healthy growth rates in 2008, even in the second half in most cases, to substantial falls in the first half of 2009. The exception being Chime Communications who have bucked the trend and grown 9.5% in the first half of 2009.

PR revenue comparison

To put these figures in context I thought I would delve a little further here and look at relative sizes and then look at the market’s view of PR via their share price performance.

Size

Income

The combined PR income of WPP, Interpublic and Omincom was still approximately £1bn in the first half of 2009 (though this includes Interpublic’s event marketing and branding business) and this in turn represented around 11% of their overall total revenues of around £9.5bn. This compares with approximately £115m of PR based revenue for Chime, Huntsworth and Next Fifteen combined in the same period which represents the majority of their circa £165m of total combined revenue. So the big three’s PR income is around 9 times more.

Market capitalisation

The combined market capitalisation of the three larger groups is approximately £16bn as at 7th September 2009 compared to approximately £300m for the three smaller ones. Over 50 times greater.

So given their relative size the results of the larger groups are a much stronger indicator of the overall global PR market’s current performance. However the higher proportion of PR income in the income of the smaller groups arguably makes them a better indicator of how the market perceives the PR industry’s prospects given that they are all (Chime excepted) suffering a reduction of PR income of broadly similar levels.

Share Price movements in 2009

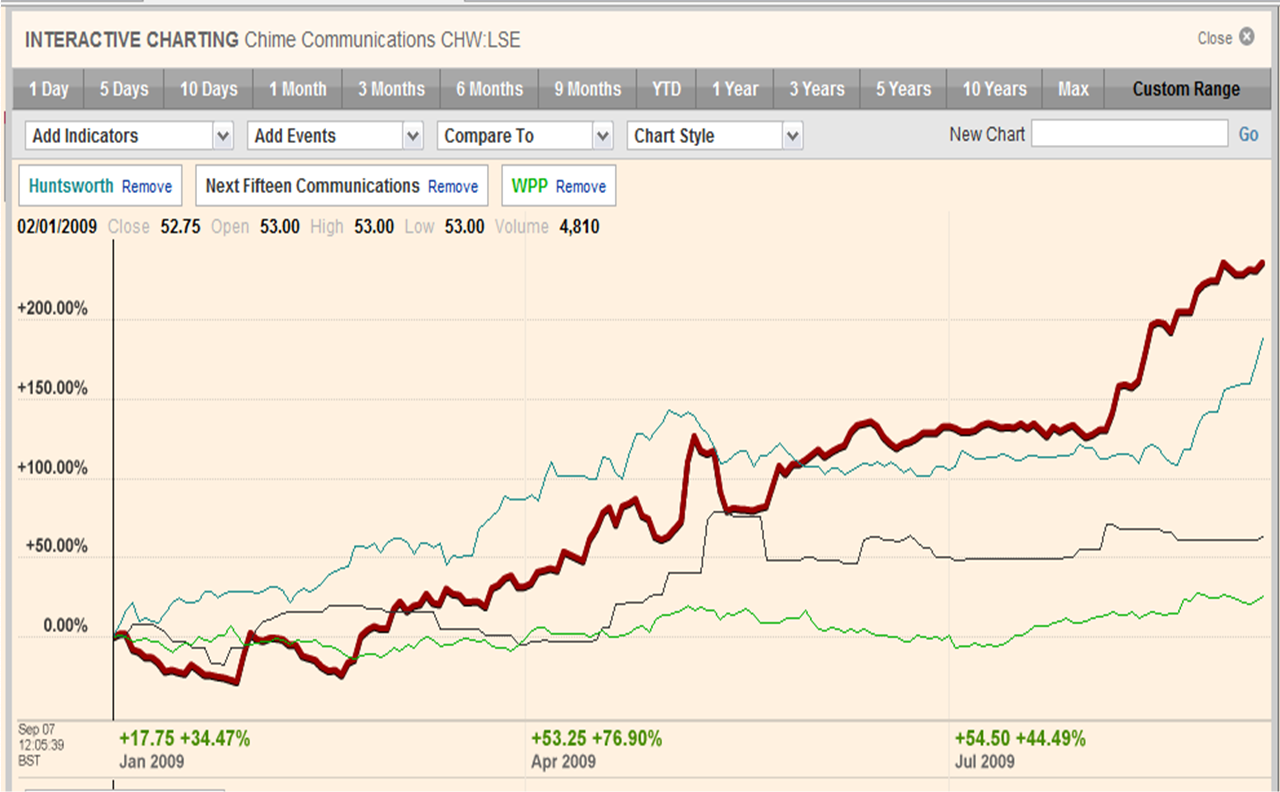
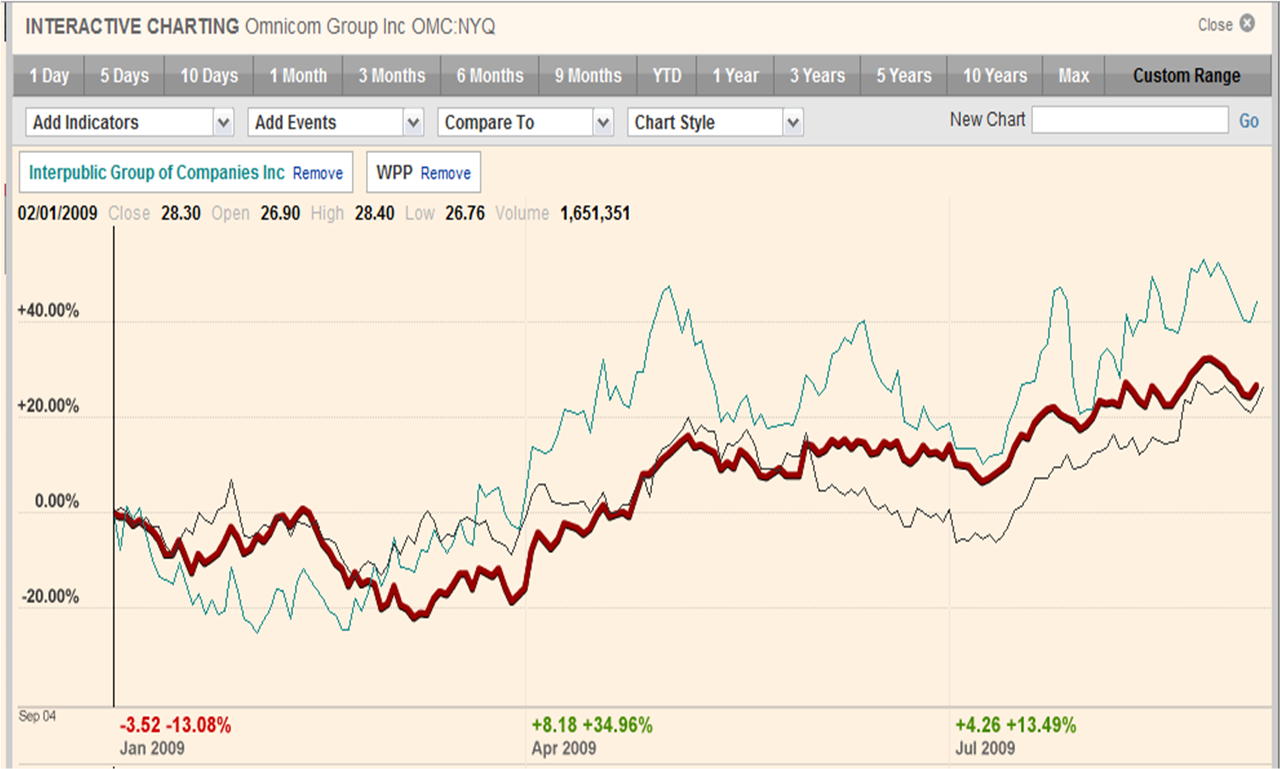
The graphs below show the movements in share prices of these same companies since the start of this calendar year. (Again you will probably need to view the actual files themselves – graph 1 – showing Chime, Huntsworth and Next Fifteen, graph 2 – showing Omnicom, Interpublic and WPP).

Comparison of PR group share prices Source FT.com

Comparison of Marcoms Groups share prices Source FT.com

The smaller groups that are either predominantly or wholly PR based (Chime, Huntsworth and Next Fifteen) have all outperformed the larger, broader, Marcoms groups during this period. Chime is up to over three times its level at the start of the year and Huntsworth isn’t far behind. Next Fifteen is also up around 60% despite predicting a significant fall in revenues in the first half of 2009. In fact their share prices are back to similar levels to where they were before the recession started.

This compares with increases of around 25-40% for the larger Marcoms groups. They have all therefore outperformed the market generally with the FTSE100 up approximately 10% and the DOW about 5% in the same period.

Of course given the difference in size the increases in the values of the larger groups are much greater in absolute £/$ terms than the smaller ones. However it is still interesting to note that these figures imply that the markets’ perceptions of the PR industry’s prospects has improved considerably over the last six months.

All of which suggests a healthy expectation of the industry’s performance in the coming months. Let’s hope they are right!

Sources/Basis

The analysis is based on publicly quoted figures included in investor presentations, interim and annual reports, SEC filings and in the case of Next Fifteen for 2009, analyst forecasts. Where possible the growth rates represent like for like organic growth excluding the impact of currency movements or acquisitions/disposals. Exceptions to this are Omnicom and Next Fifteen for whom these figures are headline changes as they do not disclose the impact of these items. Also Interpublic’s figures are based on their CMG division which includes their event marketing and branding businesses. If anyone is interested in the chapter and verse just contact me.

PRWeek Top 150 2009 Analysis – Who is best placed for 2009?

Following my recent podcast for PRWeek  on this years Top 150 (note requires subscription) I promised some detail on my findings. Since then there has been some debate about the worth of the table itself. From my point of view the table has two potential uses.

1. Ranking who are the largest (by income) PR Agencies in the UK
2. Showing how the PR industry is performing and the strategies that appear to be employed

Given that a substantial number of the largest entrants do not submit audited numbers (we will call these the Sarbanes agencies) I can understand why some have criticised its validity for the first use. Though I would humbly suggest that it is likely that the majority of the agencies that don’t submit figures would still occupy similar places to those estimated. Just not necessarily in the specific order.

But I definitely think the table has value for the second use. Allowing for agencies that have not submitted figures, or only have figures for one of the years, there are still 121 agencies in the list for which full figures have been supplied (we will call these the Audited agencies). These agencies account for approximately 60% of the combined income of the Top 150 and around two thirds of the staff. As a sample of the performance of the industry this is still a significant snap shot.

So I am going to leave the debate around point 1 to others and focus on the areas I discussed on the podcast around point 2.

What do we find?  

Summary table:

  Income change Staff change
Top 150 overall 11% 1%
Audited agencies 10% 2%
Sarbanes agencies 12% 0%

Income

Pretty consistent. And don’t think that’s because the Sarbanes estimates are all just the same. In fact the estimates range from a 22% reduction for one agency to a 36% increase for a couple of others.

Staff  

Again fairly consistent and again the estimates for the Sarbanes agencies do vary a lot from a reduction of 29% in one to an increase of 24% in another.

Different strategies  

But it is when you dig deeper, as I stated in the podcast, that you find the really interesting numbers.

Here are tables that stratify each of the groups based on their change in staff numbers year on year.

Audited agencies

Change in staff

No. of agencies

2008 Income £’m

2007 Income £’m

Change

2008 Staff

2007 Staff

Change

2008 Income / head£’000

2007 Income / head £‘000

Change

Significant increase

53

198

167

19%

2,252

1,905

18%

88

 88

0%

Little change

17

59

55

7%

639

623

3%

92

88

5%

Reduction

51

234

226

4%

2,435

2,698

-10%

96

84

15%

Total

121

491

448

10%

5,326

5,226

2%

92

86

8%

Sarbanes agencies

Change in staff

No. of agencies

2008 Income £’m

2007 Income £’m

Change

2008 Staff

2007 Staff

Change

2008 Income / head£’000

2007 Income / head£’000

Change

Significant increase

7

83

68

22%

793

701

13%

105

97

8%

Little change

7

113

99

14%

739

737

0%

153

134

14%

Reduction

9

159

150

6%

1,054

1,155

-9%

151

130

16%

Total

23

355

317

12%

2,586

2,593

0%

137

122

12%


A “Significant increase” with regards to staff numbers is defined as 5% or more; “Little change” is defined as 0-4.9%.

What you can see from the tables is that they are consistent in showing the following:

– The Reduction group is the largest by value of income in both cases. By value almost half of agencies reduced headcount in 2008 according to these numbers.

– The Reduction group increased income per head by the biggest percentage – 15% in the Audited agencies case 16% in the Sarbanes case.

– The Significant increase group achieved the highest income increase in both cases (19% Audited; 22% Sarbanes) but the smallest increase in income per head – 0% Audited and 8% Sarbanes.

Analysis  

1. The data consistently tells the same story whether audited or estimated. This is despite the significant variability in those estimates.

2. The headline numbers hide a wide variation in strategies that agencies have apparently being employing:

– Staffing up for growth
– Maintaining staff levels and apparently looking for margin improvement
– Reducing headcount to enhance profitability significantly

Implications

The question this poses is which of these groups are best placed for this year?

Have those that have gone for staff growth acquired the cream, and those with the most marketable skills, and so will be best placed to weather the storm? Have those that have gone for maintenance taken the right route as their teams and their client relationships may therefore be the most stable?

Or have those that have gone for an early reduction in headcount made the right call by reducing their cost bases before the recession bit the hardest?

I would be very interested to know the thoughts of those of you who have first hand experience of this discussion.