When you’re seeking influential content, engagement metrics such as a Facebook likes and LinkedIn shares are too simplistic. You need to know more about who engaged with it and why.
 Last week venture capitalist Bill Gurley published a post called On the Road to Recap.
Would recommend that all of those in the Unicorn ecosystem, or those considering it, read this. Times are changing: https://t.co/VRKOCTB1UZ
— Bill Gurley (@bgurley) April 21, 2016
For anyone who doesn’t know, a Unicorn in this context is a startup company with a valuation in excess of $1bn.
The post analysed in depth the current investment situation in relation to Unicorns and concluded:
“The reason we are all in this mess is because of the excessive amounts of capital that have poured into the VC-backed startup market. This glut of capital has led to (1) record high burn rates, likely 5-10x those of the 1999 timeframe, (2) most companies operating far, far away from profitability, (3) excessively intense competition driven by access to said capital, (4) delayed or non-existent liquidity for employees and investors, and (5) the aforementioned solicitous fundraising practices. More money will not solve any of these problems — it will only contribute to them. The healthiest thing that could possibly happen is a dramatic increase in the real cost of capital and a return to an appreciation for sound business execution.”
The post lit a fire in the VC and startup communities.
In fact Lissted ranks the post as the most significant piece of content on any investment related topic in the VC community in the last two months.
So I thought I’d see how it compares to other recent posts about Unicorns.
Comparison with other “Unicorn” content
I searched across the last month for posts with the most shares on LinkedIn (URLs listed at the end). If you search across all platforms you end up with very different types of unicorn!
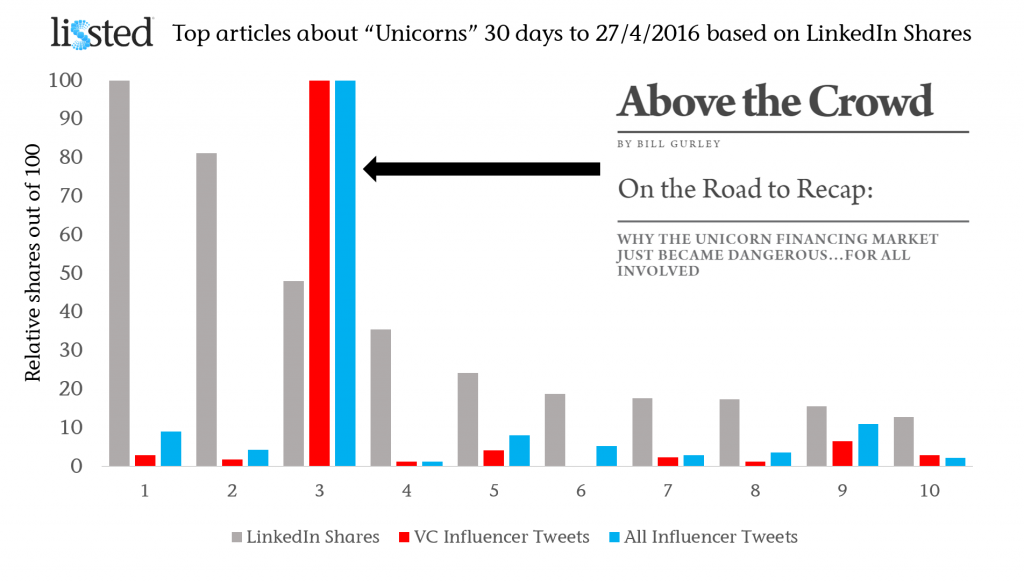
Having found the Top 10 articles on this basis, I then looked at the number of distinct members of Lissted‘s VC community on Twitter who shared each of the articles. The community tracks the tweets of over 1,500 of the most influential people and organisations in relation to venture capital and angel investment.
Finally for completeness I also looked at the number of distinct Lissted influencers from any community who tweeted a link to the piece.
In the graph the engagement numbers have been rebased for comparison, with the top ranking article for each measure being set to 100.
 The difference in reaction by the VC community and influential individuals in general is considerable.
15x more influential members of the VC community (169) shared ‘On the Road to Recap’ than the next highest article (11 -Topless dancers, champagne, and David Bowie: Inside the crash of London’s $2.7 billion unicorn Powa).
9x more influencers across all Lissted communities (419) shared the post (46 for the Powa piece).
VC Community reaction examples
Influential retweeters of Bill’s initial tweet above included Chris Sacca, Om Malik & Jessica Verrill.
Examples of key community influencers who tweeted their own views were:
there is so much truth being told in this post. it is gold. https://t.co/HSQxAzddJd — Fred Wilson (@fredwilson) April 21, 2016
quotable @bgurley: “Being private does not mean you get a free pass on scrutiny.” On the Road to Recap: https://t.co/S4gElFmP08 @500startups
— Dave McClure (@davemcclure) April 21, 2016
Best recap of current private investment climate and unicorn ecosystem I’ve read to date. Must read https://t.co/vWucGRs9Ur via @bgurley — Jeff Weiner (@jeffweiner) April 21, 2016
And people are still sharing it days later:
In case you haven’t read this post from @bgurley yet – lots of great insights. On the Road to Recap – https://t.co/0WkAETpxeI — Christoph Janz (@chrija) April 26, 2016
Mythical measurement
So, the next time you set out to find influential content, don’t get too carried away with big engagement numbers. Focus on understanding where and who that engagement came from.
That way your conclusions will be legendary, not mythical.
If you’d like to get a daily digest of the influential content in the Venture Capital community, sign up for a free Lissted account here, then visit the Venture Capital page.
Articles
1. Forget unicorns — Investors are looking for ‘cockroach’ startups now
2. What investors are really thinking when a unicorn startup implodes
3. On the Road to Recap: | Above the Crowd
4. Next Chapter: Cvent Acquired for $1.65 Billion
5. The fall of the unicorns brings a new dawn for water bears
6. Why Unicorns are struggling
7. Oracle just bought a 20-person company for $50 million
8. Silicon Valley startups are terrified by a new idea: profits
9. Topless dancers, champagne, and David Bowie: Inside the crash of London’s $2.7 billion unicorn Powa
