Unicorns, content and engagement flights of fancy

When you’re seeking influential content, engagement metrics such as a Facebook likes and LinkedIn shares are too simplistic. You need to know more about who engaged with it and why.
On the Road to Recap Venture Capital Community ReactionLast week venture capitalist Bill Gurley published a post called On the Road to Recap.

For anyone who doesn’t know, a Unicorn in this context is a startup company with a valuation in excess of $1bn.

The post analysed in depth the current investment situation in relation to Unicorns and concluded:

“The reason we are all in this mess is because of the excessive amounts of capital that have poured into the VC-backed startup market. This glut of capital has led to (1) record high burn rates, likely 5-10x those of the 1999 timeframe, (2) most companies operating far, far away from profitability, (3) excessively intense competition driven by access to said capital, (4) delayed or non-existent liquidity for employees and investors, and (5) the aforementioned solicitous fundraising practices. More money will not solve any of these problems — it will only contribute to them. The healthiest thing that could possibly happen is a dramatic increase in the real cost of capital and a return to an appreciation for sound business execution.”

The post lit a fire in the VC and startup communities.

In fact Lissted ranks the post as the most significant piece of content on any investment related topic in the VC community in the last two months. 

So I thought I’d see how it compares to other recent posts about Unicorns.

Comparison with other “Unicorn” content

I searched across the last month for posts with the most shares on LinkedIn (URLs listed at the end). If you search across all platforms you end up with very different types of unicorn!

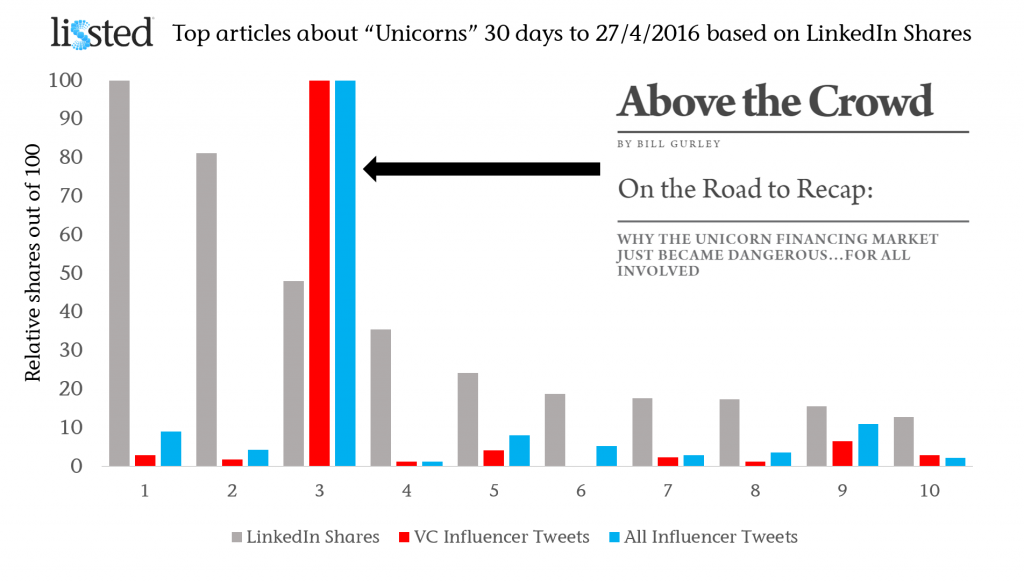
Having found the Top 10 articles on this basis, I then looked at the number of distinct members of Lissted‘s VC community on Twitter who shared each of the articles. The community tracks the tweets of over 1,500 of the most influential people and organisations in relation to venture capital and angel investment.

Finally for completeness I also looked at the number of distinct Lissted influencers from any community who tweeted a link to the piece.

In the graph the engagement numbers have been rebased for comparison, with the top ranking article for each measure being set to 100.

On the Road to Recap Venture Capital Community ReactionThe difference in reaction by the VC community and influential individuals in general is considerable.

15x more influential members of the VC community (169) shared ‘On the Road to Recap’ than the next highest article (11 -Topless dancers, champagne, and David Bowie: Inside the crash of London’s $2.7 billion unicorn Powa).

9x more influencers across all Lissted communities (419) shared the post (46 for the Powa piece).

VC Community reaction examples

Influential retweeters of Bill’s initial tweet above included Chris Sacca, Om Malik & Jessica Verrill.

Examples of key community influencers who tweeted their own views were:  

And people are still sharing it days later:  

Mythical measurement

So, the next time you set out to find influential content, don’t get too carried away with big engagement numbers. Focus on understanding where and who that engagement came from.

That way your conclusions will be legendarynot mythical.

If you’d like to get a daily digest of the influential content in the Venture Capital community, sign up for a free Lissted account here, then visit the Venture Capital page.

Lissted Venture capital page

Articles

1. Forget unicorns — Investors are looking for ‘cockroach’ startups now

2. What investors are really thinking when a unicorn startup implodes

3. On the Road to Recap: | Above the Crowd

4. Next Chapter: Cvent Acquired for $1.65 Billion

5. The fall of the unicorns brings a new dawn for water bears

6. Why Unicorns are struggling

7. Oracle just bought a 20-person company for $50 million

8. Silicon Valley startups are terrified by a new idea: profits

9. Topless dancers, champagne, and David Bowie: Inside the crash of London’s $2.7 billion unicorn Powa

10. 10 Startups That Could Beat a Possible Bubble Burst

A cautionary tale of social media statistics

Lies damn lies and statistics
It’s important to understand the full context relating to social media statistics before you act on them.

The Stat

I came across this stat the other day:

91 per cent of mentions [on social media] come from people with fewer than 500 followers.

The implication in the source blog post and whitepaper was:

When it comes to your social media strategy, don’t discount the importance of brand mentions by Twitter users with low follower counts.

It’s complicated

Follower numbers shouldn’t be the be all and end all when it comes to defining your social media strategy. Agreed.

For a start, where influence is concerned, relevance, proximity, context and other factors are crucial. And followers is a very simplistic metric and depending on how they use social platforms, may have little in common with a person’s real potential for influence.

Also, even if the mention itself doesn’t influence anyone, simply the knowledge that an individual has shown an interest in your brand in some way is potentially of value.

But while sympathising with the inference drawn, I think the statistic and its underlying data would benefit from some numerical context to better understand their implications.

N.B. I’ve focussed on Twitter in this analysis as that’s where the majority of the data in the particular research apparently came from.

Analysis

Given the stat focuses on accounts with less than 500 followers, let’s split Twitter into two groups:

– Low Follower Group – Less than 500 followers.
– High Follower Group – 500 or more followers.

And then let’s look at two relevant areas – Impressions and Retweets.

Impressions

Who could have seen brand mentions by each of these groups and potentially been influenced by them?

To calculate this we need to know the following for each group:

– Average number of followers.
– Impression rate.

Average followers

I used this estimated distribution of follower numbers across Twitter users*, combined with Lissted‘s data on nearly 2 million of the most influential accounts, to calculate a weighted average of the number of followers each group is likely to have.

Results:

– Low Follower Group – 100
– High Follower Group – 8,400

Impression rate

Every time you tweet only a proportion of your followers will actually see it. For many users this proportion could be less than ten per cent. The “impression rate” represents the total number of impressions generated by your tweet, divided by your follower number.

It only includes impressions on specific Twitter platforms – web, iOS app and Android app. This means impressions in applications like Hootsuite and Tweetdeck don’t count.

The rate is also complicated by retweets. The rate calculated by Twitter Analytics includes impressions that were actually seen by followers of the retweeting account, who may not follow you.

I’ve tried to look at retweets separately below, so for the purpose of this analysis I’m looking for impression rates without the benefit of retweet amplification.

On this basis I’ve assumed an impression rate of ten per cent for the Low Follower Group and five per cent for the High Follower Group. These assumptions are based on various articles estimating impression rates in the range of 2-10%. For the sake of prudence I’ve used a lower rate for High Follower accounts on the assumption that they could have a higher proportion of inactive and spam followers.

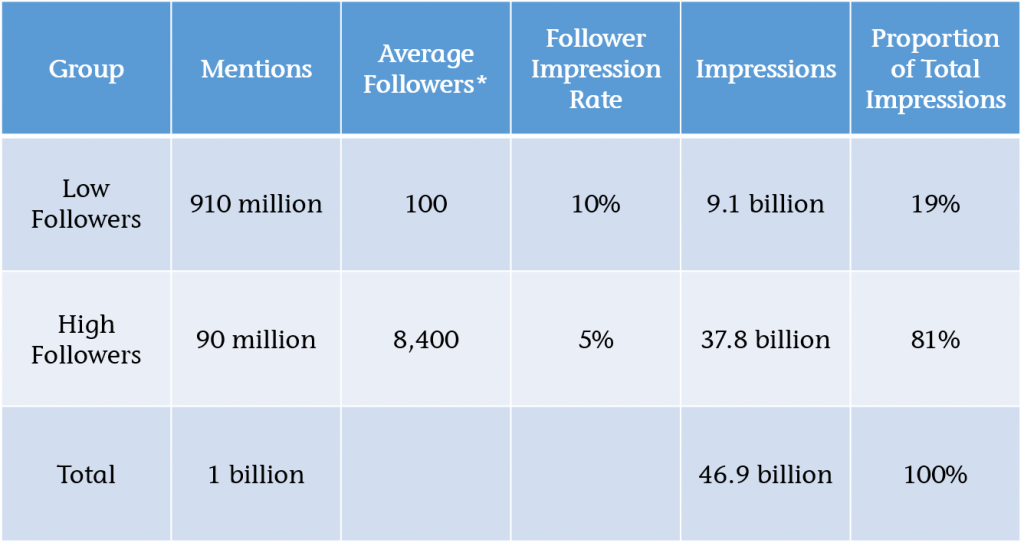
We can now calculate the proportion of total impressions related to each group as shown in this table:

Brand mentions impressions analysis

Finding: only 19 per cent of impressions relate to the Low Follower Group.

Quite simply the difference in reach of the High Follower accounts (84x higher – 8,400 v 100) more than offsets the difference in volume of mentions by the Low Follower Group (only 10x higher – 910 v 90).

For the Low Follower Group to even represent 50 per cent of the total impressions we’d need to assume an impressions rate for this group that is over 8x higher than for the High Follower Group e.g. 42% v 5%.

Though I suspect there may be a difference, is it really likely to be that much?

Retweets

Next we need to consider if any of the brand mentions were retweets. If so were the original tweets more likely to be by accounts with high or low followers?

A lot of retweets by volume are by accounts with low followers. That’s just common sense because the vast majority of Twitter users have low follower numbers. But when we’re exposed to a retweet it’s the original tweet that we’re exposed to. This is the very reason why Twitter includes the resulting impressions in the Impression rate (I’m assuming automatic retweets, not manual ones).

To understand this better I analysed a sample of over six million tweets tracked by Lissted over the last two months that were retweeted at least once. The sample included tweets by 1.27 million different accounts and collectively these tweets received over 200 million retweets in total.

Of these six million tweets, 0.6% of them (c.39,000) accounted for two thirds of the total retweets generated.

And 99 per cent of these “top tweets” were by users with 500+ followers.

Finding: a high proportion of retweets are of users with High Followers, even if many are by users with Low Followers.

Conclusion

Mentions relating to accounts with higher than 500 followers appear more likely to:

– represent the majority of initial impressions; and
– generate the majority of any resulting retweets.

In other words it’s high follower accounts that are more likely to be the source of the majority of the brand mentions that people are exposed to on Twitter.

Caveat

As I said at the start the purpose of this analysis is simply to give some proper context to an isolated statistic. Assessing the impact and actions you should take due to mentions of your brand requires consideration of a lot more factors than simply numerical exposure.

It could be the case that high follower tweets make up the vast majority of the mentions people are exposed to, but factors like trust, context, proximity and relevance could lead to mentions by low followers having more influence on business outcomes.

The key is to properly understand who is talking about you and why, and not base decisions on sweeping statistics.

*N.B the follower distribution analysis is from Dec 2013, but as Twitter hasn’t grown a huge amount in the last year, it seems reasonable to assume its validity. Happy to share my detailed workings with anyone who’s interested.

Technorati new rankings explained (I hope!)

Technorati logo betaI was involved in an Econsultancy Round Table session recently and amongst many very interesting topics discussed was (of course) the perennial conundrum of PR measurement. During the discussion a number of people commented on how they no longer placed any reliance on, or used, Technorati since it had changed how blog authority and rank were calculated.  So I thought I would see if I could get to grips with it.

In the past, Technorati’s authority score for a blog represented a count of the number of different sites that had linked to a particular blog in the preceding six months. Until the summer of 2008 this count included links where blogs appeared in blogrolls. These were removed from the calculations at that time, as they were identified as being too slow to change. Basically people’s housekeeping in connection with blogrolls was identified as being less than real time – to say the least I suspect!

The rank of a blog then represented how many blogs had a greater authority score i.e. more different inbound links than the selected blog.

The new measurements from October 2009 are less transparent but arguably more valid and useful. According to Technorati, authority is now based on a site’s linking behavior, categorization and other associated data over a short, finite period of time. This results in a score out of 1,000, with a higher score indicating greater authority. The advantages of this approach are that it is less easy for people to manufacture authority by creating fake links, plus the ratings are more dynamic, reflecting the extent to which individual blogs are the source of conversation.

They have also introduced a second authority score when viewing blogs through the Blog Directory feature that relates to a blogs relative authority within the sector or sub sector that it is classified in. For example if you want to know the blogs with a small business focus that Technorati thinks have the most authority on the subject then you can see a list here. In this case the Online Marketing Blog is assessed at having quite a bit more authority (961) within the small business blogs than the second ranked blog is this sector, Social Media Today (871). This is despite their overall authority scores being 614 and 689 respectively. Indicating that though SMT has more authority generally, Online Marketing Blog is considered to be more influential within the small business sector.

This is an interesting, and I would suggest, very useful change as it is relative and relevant authority that matters when assessing the importance of different sites not an absolute measure. We take the same approach to ranking sites at RealWire when calculating our RealWire Influence Rating for coverage achieved. If you don’t take this relative/relevant approach then you will always end up saying that the most influential sites are ones in the biggest communities e.g. Tech, but that is obviously not appropriate if you were trying to assess which sites were influential to, say, the fashion sector.

You can also see those blogs that are rising and falling the most within that sub sector on the right hand side of the same page.

I reckon these changes mean that it is easier to find key blogs that are relevant to you and those that are becoming more and less influential over time. And no this isn’t just because my blog now appears in the top 20k! :-) What do others think?

RealWire “Releasing influence” – our new animation goes live

Following on from our Online Media animation from the start of this year we have just finished the second part of our “trilogy” – “Releasing Influence“. *Please note this animation is more self promotional in nature*.

The first part of the film follows on from “The Online Media” and describes how news releases have the potential to achieve influence in this world. The second describes how RealWire can help senders of news to do just that and also how our service helps them to understand the impact they have had.

The last of the three should be ready in a few weeks time and will deal with the importance of delivering relevance to recipients of news.

But for now here is the video. Would love to get people’s feedback.

RSS subscriptions reach 100 million?

According to Forrester Research the use of RSS has reached 11% of US online adults. Steve Rubel and others have discussed the other main finding that of the other 89% only 17% are interested in adopting RSS in the future. The implication being that RSS is running out of steam and needs mass education to continue its growth rate.

However I wonder if this discussion is potentially missing a relatively obvious numeric point. What does 11% of US online adults equate to? With an estimated 220 million US internet users applying 11% gives 24 million that use RSS (and another 26 million who apparently aren’t sure if they do – 12% responded thus). However this assumes that minor users follow the same proportion which may not be the case but for the purpose of this calculation lets accept this limitation. To put this in context this compares with around 60-70 million US users of Facebook and Myspace. Unfortunately the study was only based on a survey of US internet users so it is not possible to extrapolate this analysis across global internet users on a rigorous basis. However if we make the (over?) simplifying assumption that this study is indicative of general RSS use then based on approximately 1.5bn internet users worldwide this would give approximately 165 million RSS users worldwide. As penetration rates go I would say that was still pretty impressive. Obviously these calculations are more back of a postage stamp than back of an envelope :) but they illustrate the point that this percentage implies some fairly big numbers in absolute terms.

The other point to consider is the potential influence implications of RSS subscriptions. What would be really useful to know would be the detailed makeup of the 11% and the sites that they subscribe to. Were it the case for instance that this analysis showed that key influencers and decision makers in certain markets are proportionally more likely to receive their news via RSS its importance in influence terms would be magnified. If anyone has access to the full report and any information on this I would be delighted to hear from you.