Metrics are vanity, insights are sanity, but outcomes are reality

There’s an old business saying:

Turnover is vanity, profit is sanity, but cash is reality*.

* another version replaces reality with “king”

The implications are pretty obvious. No matter how much turnover (or revenue if you prefer) you generate, if it doesn’t turn into profit you’ll only survive if someone keeps pumping in cash.

If you generate profit, but you don’t convert that profit to hard cash, then you’ll end up in the same boat.

A similar issue applies to social listening, analytics and measurement in general.

Vanity metrics and pretty noise

You can’t move for the number of tools and platforms that will give you graphs and metrics of social media data. The frequency of mentions of this, how many likes of that, the number of followers of the other. All wrapped up in a beautifully designed dashboard.

The thing is this “analysis” is often nothing more than pretty noise.  And the danger is it can be worse than meaningless, it can be misleading.

Insight

Really insightful

To find real insight we need to know the who, what and why of the data behind the numbers, how this relates to what we’re seeking to discover and most importantly of all, we need to know the right questions to ask.

The UK General Election social media coverage was a great example of how not to do this. All the attention was on counting stuff and comparing who had more of this and less of that.

Far too few asked questions like: who was active in these online conversations, why were they participating, and were they likely to be representative of what you were trying to understand?

Private Eye Twitter analysis

It’s the outcome that really counts

Finally “actionable insight” is a phrase we hear all the time. But even when it’s an accurate description, the key element is “able”.

If we don’t possess the skills, resources or confidence to take the action required, then the whole exercise was pointless. So don’t bother asking a question unless you’re able to follow through on the answer.

Because it all comes down to this – what is the outcome of your action in the real world?

After all, just ask Ed Miliband whether his Twitter metrics were much consolation when it came to the result of the election.

Ed Miliband

Hat tip to Andrew Smith who inspired this post with his comment to me that with Lissted we’re seeking to focus on “sanity, not vanity”.

A cautionary tale of social media statistics

Lies damn lies and statistics
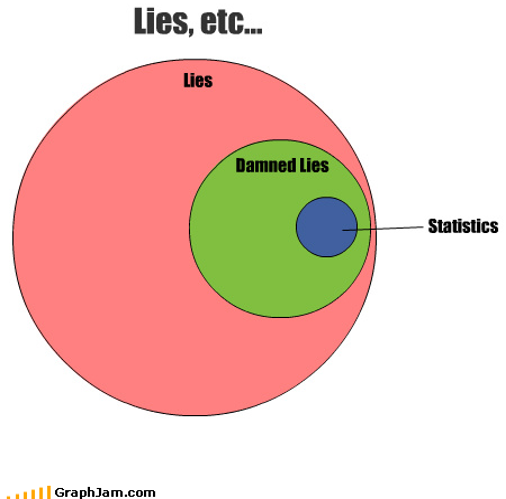
It’s important to understand the full context relating to social media statistics before you act on them.

The Stat

I came across this stat the other day:

91 per cent of mentions [on social media] come from people with fewer than 500 followers.

The implication in the source blog post and whitepaper was:

When it comes to your social media strategy, don’t discount the importance of brand mentions by Twitter users with low follower counts.

It’s complicated

Follower numbers shouldn’t be the be all and end all when it comes to defining your social media strategy. Agreed.

For a start, where influence is concerned, relevance, proximity, context and other factors are crucial. And followers is a very simplistic metric and depending on how they use social platforms, may have little in common with a person’s real potential for influence.

Also, even if the mention itself doesn’t influence anyone, simply the knowledge that an individual has shown an interest in your brand in some way is potentially of value.

But while sympathising with the inference drawn, I think the statistic and its underlying data would benefit from some numerical context to better understand their implications.

N.B. I’ve focussed on Twitter in this analysis as that’s where the majority of the data in the particular research apparently came from.

Analysis

Given the stat focuses on accounts with less than 500 followers, let’s split Twitter into two groups:

– Low Follower Group – Less than 500 followers.
– High Follower Group – 500 or more followers.

And then let’s look at two relevant areas – Impressions and Retweets.

Impressions

Who could have seen brand mentions by each of these groups and potentially been influenced by them?

To calculate this we need to know the following for each group:

– Average number of followers.
– Impression rate.

Average followers

I used this estimated distribution of follower numbers across Twitter users*, combined with Lissted‘s data on nearly 2 million of the most influential accounts, to calculate a weighted average of the number of followers each group is likely to have.

Results:

– Low Follower Group – 100
– High Follower Group – 8,400

Impression rate

Every time you tweet only a proportion of your followers will actually see it. For many users this proportion could be less than ten per cent. The “impression rate” represents the total number of impressions generated by your tweet, divided by your follower number.

It only includes impressions on specific Twitter platforms – web, iOS app and Android app. This means impressions in applications like Hootsuite and Tweetdeck don’t count.

The rate is also complicated by retweets. The rate calculated by Twitter Analytics includes impressions that were actually seen by followers of the retweeting account, who may not follow you.

I’ve tried to look at retweets separately below, so for the purpose of this analysis I’m looking for impression rates without the benefit of retweet amplification.

On this basis I’ve assumed an impression rate of ten per cent for the Low Follower Group and five per cent for the High Follower Group. These assumptions are based on various articles estimating impression rates in the range of 2-10%. For the sake of prudence I’ve used a lower rate for High Follower accounts on the assumption that they could have a higher proportion of inactive and spam followers.

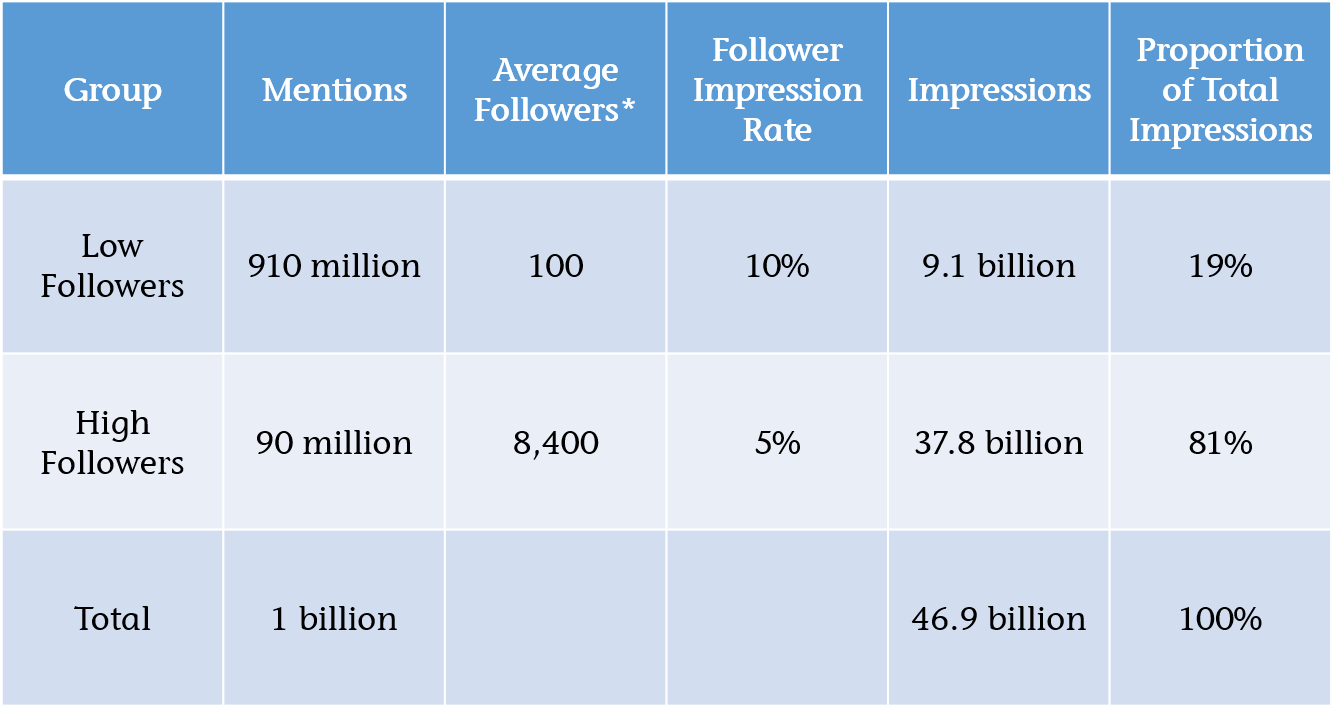
We can now calculate the proportion of total impressions related to each group as shown in this table:

Brand mentions impressions analysis

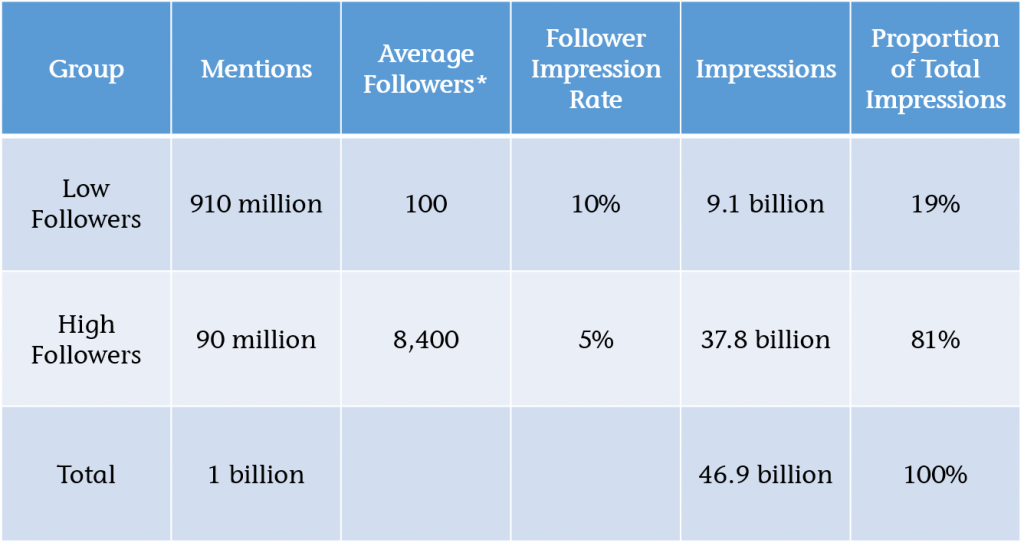
Finding: only 19 per cent of impressions relate to the Low Follower Group.

Quite simply the difference in reach of the High Follower accounts (84x higher – 8,400 v 100) more than offsets the difference in volume of mentions by the Low Follower Group (only 10x higher – 910 v 90).

For the Low Follower Group to even represent 50 per cent of the total impressions we’d need to assume an impressions rate for this group that is over 8x higher than for the High Follower Group e.g. 42% v 5%.

Though I suspect there may be a difference, is it really likely to be that much?

Retweets

Next we need to consider if any of the brand mentions were retweets. If so were the original tweets more likely to be by accounts with high or low followers?

A lot of retweets by volume are by accounts with low followers. That’s just common sense because the vast majority of Twitter users have low follower numbers. But when we’re exposed to a retweet it’s the original tweet that we’re exposed to. This is the very reason why Twitter includes the resulting impressions in the Impression rate (I’m assuming automatic retweets, not manual ones).

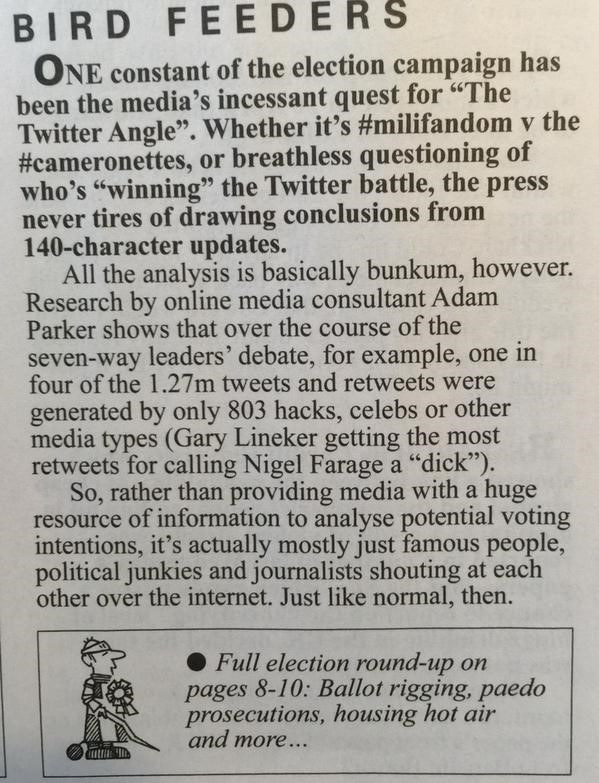
To understand this better I analysed a sample of over six million tweets tracked by Lissted over the last two months that were retweeted at least once. The sample included tweets by 1.27 million different accounts and collectively these tweets received over 200 million retweets in total.

Of these six million tweets, 0.6% of them (c.39,000) accounted for two thirds of the total retweets generated.

And 99 per cent of these “top tweets” were by users with 500+ followers.

Finding: a high proportion of retweets are of users with High Followers, even if many are by users with Low Followers.

Conclusion

Mentions relating to accounts with higher than 500 followers appear more likely to:

– represent the majority of initial impressions; and
– generate the majority of any resulting retweets.

In other words it’s high follower accounts that are more likely to be the source of the majority of the brand mentions that people are exposed to on Twitter.

Caveat

As I said at the start the purpose of this analysis is simply to give some proper context to an isolated statistic. Assessing the impact and actions you should take due to mentions of your brand requires consideration of a lot more factors than simply numerical exposure.

It could be the case that high follower tweets make up the vast majority of the mentions people are exposed to, but factors like trust, context, proximity and relevance could lead to mentions by low followers having more influence on business outcomes.

The key is to properly understand who is talking about you and why, and not base decisions on sweeping statistics.

*N.B the follower distribution analysis is from Dec 2013, but as Twitter hasn’t grown a huge amount in the last year, it seems reasonable to assume its validity. Happy to share my detailed workings with anyone who’s interested.

PRFilter Technology PR Rankings launched

The PRFilter platform has been publicly live for a month now and in that time there have been thousands of searches performed. But as well as finding relevant press releases PRFilter now has a wealth of data on press release content.

Independently Adam Sherk last month used PRFilter to look at how often buzzwords are used in releases – read more about it here. We in turn thought it would be interesting to look at which technology brands, topics and products have been talked about most in press releases over the last couple of months. As an industry there is a lot of time and money spent analysing what the media writes/talks about, but what are PRs trying to talk about and do the two things fit?

Thats why we have produced our first PRFilter Technology PR Rankings. These rankings analyse the tens of thousands of releases indexed by PRFilter each month and look for the most talked about technology brands, topics and products within them.

Highlights from this first month (February 2011) include:

  • MicrosoftFacebook and Verizon were the top three most referenced technology brands.
  • Cloud related technologies, websites and wireless were the top three most referenced technology topics with iPhone and iPad the top ranking products.
  • Mentions of Microsoft and Facebook were around twice the number of Apple (ranked 5th).
  • Releases mentioning cloud technologies were more than twice as frequent as those referencing social media however this was down from three times as frequent in January.
  • iPad related releases were down 37% perhaps reflecting a calm before March iPad2 storm.
  • Significant increases in mentions of telecoms brands e.g. EricssonNokia and ZTE and technologies e.g. LTE and NFC, reflecting the hosting of Mobile World Congress during the month.

A presentation of the full details of the Top 25 technology brands and the Top 50 technology topics/products can be found here or view below.

This first month’s rankings demonstrate that a large number of stories are being created around certain brands and topics and not all of these are necessarily in areas that are likely to provoke great interest from the media.

We hope that producing these monthly rankings will assist public relations practitioners in developing a higher proportion of stories that journalists and bloggers find of interest and lead to improved coverage for the companies concerned.

As this is the first month there are bound to be things we could do better or information people would like to see next time so please let us know in the comments.

We have also started with Technology because that was the sector PRFilter was initially focussed on when it was first launched. However if there is demand we will look to expand the rankings to cover other sectors. Again feel free to let us know.

Dublin, Guinness and your website analytics

I had a great time last week speaking at the Net Imperative Digital Roadshow in Dublin. Apart from enjoying a great pint of Guinness :-) I found out that Twitter is alive and well in Ireland with over 20 active users in the audience.

As part of my presentation I covered using your website statistics to help you plan and measure the success of your online PR activities. For those of you who aren’t yet active in the online world the following is a (slightly) edited version of an article from my latest Fresh Business Thinking online PR newsletter which covered this topic.

How your website analytics can help your online PR

One of the great things about the Online Media World is that nearly everything you want to monitor or measure is there to be found. In the “real” world it is almost impossible to know what people are saying about you to their friends or colleagues in the pub or round the water cooler. Online there is a vast array of tools which allow you to track what people are saying about you including RSS, social bookmarking and Twitter.

But one of the less obvious PR tools in your armoury is your website statistics package. If you aren’t using a website statistics package yet to track activity on your site then if you only do one thing after reading this article make it signing up for such a service. Google Analytics for example is free, links to their AdWords system and can track multiple websites from one simple to use dashboard.

Why is this relevant to Online PR? Because amongst other things it tells you a number of significant pieces of information about your public relations activity.

1.Referring sites No.1 – You can use your analytics package to tell you if articles that have been written about you in response to, for instance, a news release, subsequently send traffic to your website. Assuming they included a link to your site in the article of course.

2.Referring sites No.2 – What about other news sites that are sending visitors to your website? These sites must be talking about you and by tracking these referrals you can then visit these sites and see what they said and potentially start a dialogue with them if you think you have more information they might find of interest.

3.Referring sites No.3 – Are you getting visits from social bookmarking sites such as Delicious, social networking sites such as Facebook or microblogging sites such as Twitter? If you are then it could be worth your while investing time in finding out what the relevant members of these communities think is interesting enough to spend time sharing, commenting or talking about you.

4.Keywords – The keywords that are driving traffic to your website also gives you an indication of what people find interesting about you. This could be useful when thinking about what stories might be of relevant as part of your online PR activities.

5.Visitor information – Are you getting visits from particular geographic locations? If so are they markets you currently operate in and try and target from a promotional perspective? If not then perhaps it is worth considering engaging these visitors to understand why they find your organisation relevant.

These are just a few examples of how your website statistics can give you an insight into what people find interesting about you and help you to craft a much more effective online PR strategy that is based around starting conversations with people who are relevant to you and about topics they want to talk about.