Is Twitter’s R&D a case of flogging a dead (race) horse?

Twitter has invested $2.2bn in research and development over the last three years. But with growth in net revenue slowing considerably in 2016, it appears this sizeable investment is no longer paying dividends. Data for this post can be found here.

As Twitter’s revenue growth slows and its share price continues to slide, it’s not surprising to find the company’s costs being scrutinised. Earlier this week Techcrunch looked at executive pay and the remuneration of CFO/COO Anthony Noto in particular.

Research and development expenditure is a key area for a technology company like Twitter. You would expect it to be a significant cost, and sure it enough it is. You would also expect to see a significant return from such investment in user growth and ultimately in revenue. Twitter’s lack of user growth has been widely discussed so I’ve focussed on the $s.

Twitter’s 2016 R & D Performance

Twitter spent $713m on research and development in 2016.

Twitter financials last 5 years

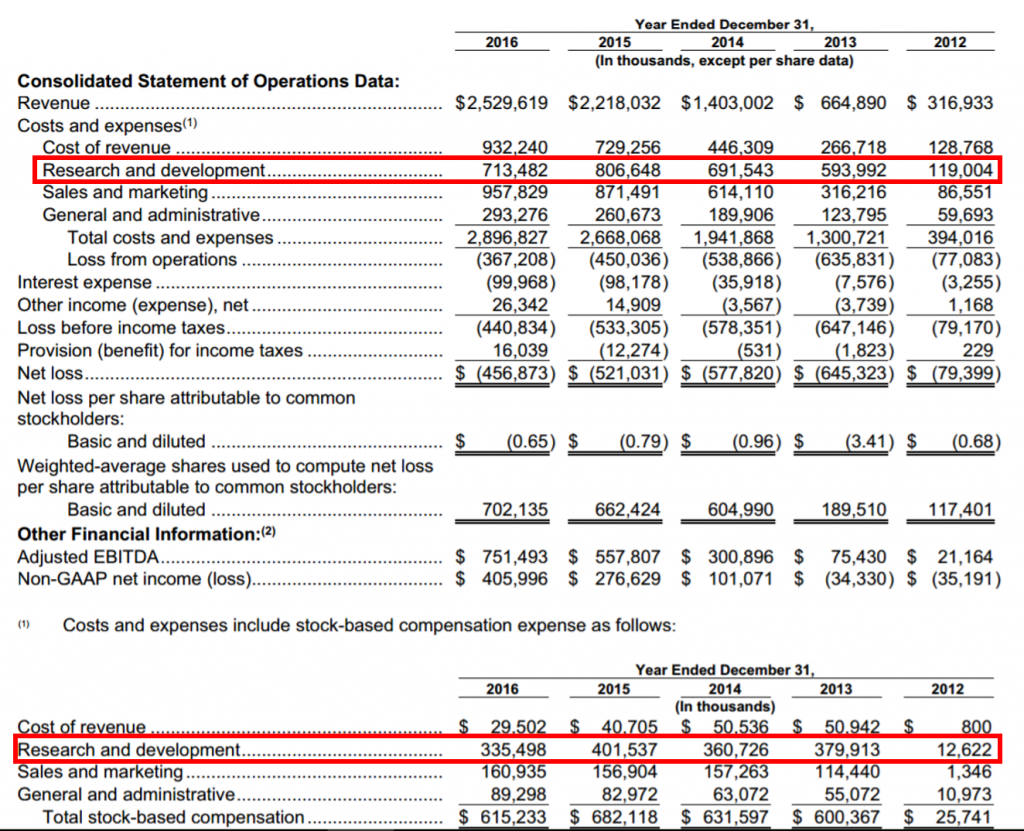
At the same time its net revenue (revenue minus the direct costs of earning that revenue) grew by $109m, a 7.3 per cent increase on 2015.

That represents $0.15 of additional net revenue for every $1 spent on R&D.

Facebook’s performance 10x better

To put that in context Facebook’s equivalent numbers were:

  • R & D spend – $5,919m
  • Net revenue growth $8,788m.
  • $1.48 of additional net revenue for every $1 spent on R&D.

If Twitter had achieved the same level of net revenue growth for every $ spent on R&D its net revenue would have risen by over $1bn in 2016 ($1.48 x $713m = $1,055m).

This would have represented a 70.8 per cent increase in net revenue versus the actual growth achieved of 7.3 per cent.

Decline in Twitter R & D returns

As the graph below shows, 2015 and 2014 were considerably better by this metric.

Twitter R and D impact on net revenue

Twitter achieved $0.66 of net revenue increase per $ in R&D spend in 2015 and $0.81 in 2014.

These figures were similar to those achieved by Alphabet (Google), though still only half (2014) and two thirds (2015) of Facebook’s.

These numbers show that matching Facebook’s 2016 performance of $1.48 revenue/$ R&D was probably too much of a tall order.

However even if Twitter’s 2016 performance had only been equal to its own 2015 figure the company would still have seen a rise in net revenue of $470m ($0.66 x $713m), $361m more than was actually achieved. This would have meant a growth rate of 31.6 per cent.

You can imagine the significant impact on the company’s share price that a stronger growth story like this would have.

So R&D is still being heavily funded, but revenue growth is fast disappearing. This begs the questions, where, in who and in what are these funds being invested?

Share based compensation

Another factor here is Twitter’s R & D staff are the single biggest recipients of share based compensation (SBC). Anyone unfamiliar with share based compensation please skip to the end of the post for a brief explanation of how it works before reading further.

In the last three years Twitter’s total share based compensation expense has totalled $1,929m and has exceeded the total adjusted EBITDA generated by the company ($1,610m).

Effectively all the underlying profit generated (and more) since its IPO has been invested in remunerating employees and officers.

Research and development SBC has totalled $1,099m over the last three years. This represents half of the $2.2bn invested in R&D and shows how crucial share based remuneration is to Twitter’s strategy for attracting and retaining product and engineering talent.

The problem is that this represents a transfer of value from shareholders to R&D staff of over $1bn since the start of 2014. Meanwhile any innovation and improvements made are having a declining impact on revenue growth, resulting in a reduction in Twitter’s value of $25bn over the period.

Not what you’d call a great deal for shareholders.

What does this mean?

I can see two key factors at work here:

  1. Competition for talent – Twitter needs to attract the same quality of people who could work at Facebook, Google et al. It therefore needs to offer competitive remuneration packages. Share based compensation has apparently formed a key part of this to date.
  1. Creative block – lack of successful new ideas, innovation and improvements to drive revenue growth.

Implying the following question:

Should Twitter be getting more out of its R&D resources or are even these talented individuals unable to add significant value to the platform?

If the former, then this is a management issue which needs addressing and fast.

If the latter then the company should be looking outside of its own teams for ideas and innovation and allocating funds accordingly.

Either way, if it continues to invest huge sums in R&D without significant improvement in net revenues, then the company’s declining value appears unlikely to turnaround.

Share based compensation expense – an explanation

In a company’s accounts share based compensation (SBC) expense represents value given to employees of the company in the form of shares or options.

It’s calculated in various ways, but in simple terms it’s equal to:

SBC expense = Market value (of shares/options provided) – Amount paid by employee

Share based compensation generally forms part of an employee’s remuneration package to attract new joiners, motivate them to create value and/or improve retention.

SBC is a non cash expense, however because it relates to the creation of new shares – either immediately or potentially in the future when options become exercisable – its effect is to dilute existing shareholders. Again in simple terms this dilution is equal to the value of the expense.

Shareholders therefore expect to see a return on this investment greater than the value that they have been diluted by.

Example:

Note this is a highly simplified example, but it should help to get the gist.

Today ABC Company has a market capitalisation (the value of its equity to its shareholders) of $1bn.

It gifts shares to a group of highly sort after new employees who it believes will be instrumental in creating a new product.

The SBC expense of these shares is $10m at the point they are gifted i.e. 1% of its equity value.

The new employees are prohibited from selling the shares for a period of one year.

All things being equal the existing shareholders now only own 99% or $990m of the company.

A year later the company is valued at $1.2bn, with the $200m increase in value being wholly attributed to the success of the new product created by the team.

The shareholders 99% is therefore worth $1.188bn representing a gain of $188m.

The new joiners can now sell their shares worth $12m ($10m value when they were granted plus 1% of the increase of $200m in the overall value of the company).

Everyone’s a winner. The company didn’t have to find any cash. The new employees have banked $12m (less associated taxes) and shareholders have seen the value of their shares rise by nearly 19%.

Note: I do not own any shares in Twitter, Facebook or Alphabet. All analysis is based on publicly available information from Annual Reports, SEC filings and Proxy Statements.

How Twitter could help solve Facebook’s fake news problem

Twitter shares by influential individuals and organisations could be harnessed in an automated news content rating system.

This system could assist Facebook in identifying articles that have a high risk of being fake. The methodology is based on a journalistic verification model.

Examples: the model would have rated as high risk:

-FINAL ELECTION 2016 NUMBERS: TRUMP WON BOTH POPULAR ( 62.9 M -62.2 M ) – about the election results. It was ranking top of Google for a search for “final election results” earlier this week and has had over 400,000 interactions on Facebook. It was identified as fake (obviously) by Buzzfeed.

–  Pope Francis Shocks World, Endorses Donald Trump for President, Releases Statement‘. Shared  nearly 1 million times on Facebook. Now taken down, having been reported as fake by The New York Times

The rating system described below is subject to patent pending UK 1619460.7.

At the weekend Mark Zuckerberg described as “pretty crazy” the idea that sharing fake news on Facebook contributed to Donald Trump being elected President.

He went on to say in a Facebook post:

“Of all the content on Facebook, more than 99% of what people see is authentic. Only a very small amount is fake news and hoaxes. The hoaxes that do exist are not limited to one partisan view, or even to politics. Overall, this makes it extremely unlikely hoaxes changed the outcome of this election in one direction or the other.”

“That said, we don’t want any hoaxes on Facebook. Our goal is to show people the content they will find most meaningful, and people want accurate news. We have already launched work enabling our community to flag hoaxes and fake news, and there is more we can do here. We have made progress, and we will continue to work on this to improve further.”

Yesterday, Business Insider reported a group of students had hacked together a tool that might help.

I think part of the answer lies in another social network, Twitter.

An important aside

It’s important to note the topic of “fake” news is not black and white. For example, parody accounts and sites like The Onion are “fake news” that many people enjoy for the entertainment they provide.

There’s also the question of news that is biased, or only partially based in fact.

The idea proposed below is simply a model to identify content that is:

1. more likely to be fake; and

2. is generating a level of interaction on Facebook that increases the likelihood of it being influential.

Verification and subsequent action would be for a human editorial approach to decide.

Using Twitter data to identify potentially fake news

In its piece on Zuckerberg’s comments, The New York Times highlighted this article Pope Francis Shocks World, Endorses Donald Trump for President, Releases Statement (now removed) that had been shared nearly a million times on Facebook. It’s fake. This never happened.

If it had been true it would obviously have been a big story.

As such you’d expect influential Trump supporters, Republicans and other key right wing media, organisations and individuals to have been falling over themselves to highlight it.

They weren’t.

Lissted tracks the Twitter accounts of over 150,000 of the most influential people and organisations. This includes over 8,000 key influencers in relevant communities such as Republicans and US Politics, as well as potentially sympathetic ones such as UKIP and Vote Leave.

Of these 150,000+ accounts only 6 shared the article.

Extending the analysis

Lissted has indexed another 106 links from the same domain during the last 100 days.

The graph below shows analysis of these links based on how many unique influencer shares they received.

analysis-of-links

You can see that 74 of the 107 links (including the Pope story) were only shared by a single member of the 150,000 influencers we track. Only 5 have been shared by 6 or more and that includes the Pope story.

That’s just 196 influencer shares in total across the 107 links.

Yet, between them these URLs have been interacted with 12.1 million times on Facebook.

And of course these are the stories that have been shared by an influencer. There could be more that haven’t been shared at all by influential Twitter users.

Lissted’s data also tells us:

– 133 of the 150,000 influencers (less than 0.1%) have shared at least one of its articles; and

– the article published by the site that has proved most popular with influencers has received 10 shares.

How could this help identify high risk news?

You can’t identify fake news based simply on levels of reaction, nor based on analysing what they say. You need a journalistic filter. Twitter provides a potential basis for this because its data will tell you WHO shared something.

For example, Storyful, the Irish social media and content licensing agency, has used Twitter validation by specific sources as a way of identifying content that is more likely to be genuine.

I don’t know why very few of the influencers Lissted has been tracking shared the piece. But my suspicion would be that as influential members of their communities they’re:

– capable of spotting most fake news for what it is, and/or

– generally less likely to share it as even when it serves their purpose they know that they could be called out for it (they’re more visible and they’ve got more to lose); and /or

– less likely to be exposed to it in the first place.

Obviously, not all content will be shared on Twitter by these 150,000 accounts. But you can bet your bottom dollar that any vaguely significant news story will be. The temptation to want to highlight a genuine story is just too great.

Comparison to example of genuine content

To give the Pope story numbers some context, the table below shows a comparison to this piece on the Donald Trump website – Volunteer to be a Trump Election Observer (NB: post victory the URL now redirects to the home page).

comparion-table

Both URLs have similar Facebook engagement, but there’s a huge difference in the influencer metrics for the article and the domain.

This is just one example though. If we build a model based on this validation methodology does it provide a sound basis for rating content in general?

NB: the model that follows focuses on content from websites. A similar, approach could be applied to other content e.g. Facebook posts, YouTube videos etc.

Proof of concept

To test the methodology I built a rating model and applied it to three sets of data:

1. The 107 links identified from endingthefed.com – data here.

2. Links that Newswhip reported as having 250,000+ Facebook interactions in the period 15/9/16 – 14/11/16 – data here.

3. A random sample of over 3,000 links that were shared by influencers from the specific communities above in the period 15/10/16 -14/11/16 – data here.

The rating model gives links a score from 0 – 100. With 100 representing a links that has a very high risk of being fake and zero being a very low risk.

To rate as 100 a link would need to have:

– received 1,000,000 Facebook interactions; and
– be on a site that has never been shared by one of the 150,000 influencers, including the link itself.

The distribution of rating for the random sample is as follows:

distribution-of-articles-by-risk-rating

Mark Zuckerberg’s commented that less than 1 per cent of content on Facebook is fake. If we look at the distribution we find that 1 per cent corresponds to a score of 30+.

The distribution also shows that no link in the sample scored more than 70.

Finally over 90 per cent of URLs rated at less than 10.

On this basis I’ve grouped links in the three data sets above into 4 risk bands:

Exceptional – 70+
High – 30 -70
Medium – 10 – 30
Low – 0-10

Applying these bands to the three sets gives:

distribution-of-articles-by-risk-rating across three sets

Unsurprisingly a high proportion of the 250,000+ group are rated as Medium to Exceptional risk. This reflects the fact that there are so few of them – 182 – and the implicit risk of being influential due to their high engagement.

Verifying these would not be a huge drain on resources as that translates to just 2 or 3 links per day!

The graph also shows how high risk the endingthefed site is with over 95 per cent of its content rated as High or Medium.

HEALTH WARNINGS

1. Being ranked as medium – exceptional risk does NOT mean the content is fake. It is simply an indicator. Just because one article on a site is fake does not mean that all the risky content is.

Also an article could be genuine viral content that’s come out of the blue from a new source.

The value in the model is its ability to identify the content that needs verifying the most. Such verification should then be done by professional journalists.

2. The rankings only reflect the 150,000 individuals and organisations that Lissted currently tracks. There could be communities that aren’t sufficiently represented within this population.

This isn’t a flaw in the methodology however, just the implementation. It could be addressed by expanding the tracking data set.

Example findings

The top 10 ranked articles in the 250,000+ group are as follows:

1. Mike Pence: ‘If We Humble Ourselves And Pray, God Will Heal Our Land’ (506k Facebook interactions, 0 influencer shares)

2. Just Before the Election Thousands Take Over Times Square With the Power of God (416k Facebook interactions, 0 influencer shares)

3. TRUMP BREAKS RECORD in Pennsylvania “MASSIVE CROWD FOR TRUMP! (VIDEO) – National Insider Politics (207k Facebook interactions, 0 influencer shares)

4. SUSAN SARANDON: CLINTON IS THE DANGER, NOT TRUMP – National Insider Politics (273k Facebook interactions, 0 influencer shares)

5. FINGERS CROSSED: These 11 Celebrities Promised To Leave America If Trump Wins (455k Facebook interactions, 1 influencer share)

6. Trump: No Salary For Me As President USA Newsflash (539k Facebook interactions, 0 influencer shares)

7. I am. (454k Facebook interactions, 1 influencer share)

8. A Secret Has Been Uncovered: Cancer Is Not A Disease But Business! – NewsRescue.com (336k Facebook interactions, 0 influencer shares)

9. The BIGGEST Star Comes Out for TRUMP!! Matthew McConaughey VOTES Trump! (294k Facebook interactions, 1 influencer share)

10. Chicago Cubs Ben Zobrist Shares Christian Faith: We All Need Christ (548k Facebook interactions, 1 influencer share)

My own basic verification suggests some of these stories are true. For instance Donald Trump did indeed say that he would not draw his Presidential salary.

However the Matthew McConaughey story is false and by the article’s own admission the Pennslyvania rally image is from April not October, plus there are no details on what “records” have been broken.

From outside the top 10 this post, rated as high risk, FINAL ELECTION 2016 NUMBERS: TRUMP WON BOTH POPULAR ( 62.9 M -62.2 M ) about the election results was ranking top of Google for a search for “final election results” earlier this week. It was identified as fake by Buzzfeed.

It would be great if any journalists reading this would go through the full list of articles rated as high risk and see if they can identify any more.

Equally if anyone spots URLs rated as low risk that are fake please let me know.

Further development

This exercise, and the mathematical model behind it, were just a rudimentary proof of concept for the methodology. An actual system could:

– utilise machine learning to improve its hit rate;

– flag sites over time which had the highest inherent risk of fake content;

– include other metrics such as domain/page authority from a source such as Moz.

Challenge to Facebook

A system like this wouldn’t be difficult to setup. If someone (Newswhip, BuzzSumo etc) is willing to provide us with a feed of articles getting high shares on Facebook, we could do this analysis right now and flag the high risk articles publicly.

Snopes already does good work identifying fake stories. I wonder if they’re using algorithms such as this to help? If not then perhaps they could.

Either way, this is something Zuckerberg and Dorsey could probably setup in days, hours perhaps!

RSS subscriptions reach 100 million?

According to Forrester Research the use of RSS has reached 11% of US online adults. Steve Rubel and others have discussed the other main finding that of the other 89% only 17% are interested in adopting RSS in the future. The implication being that RSS is running out of steam and needs mass education to continue its growth rate.

However I wonder if this discussion is potentially missing a relatively obvious numeric point. What does 11% of US online adults equate to? With an estimated 220 million US internet users applying 11% gives 24 million that use RSS (and another 26 million who apparently aren’t sure if they do – 12% responded thus). However this assumes that minor users follow the same proportion which may not be the case but for the purpose of this calculation lets accept this limitation. To put this in context this compares with around 60-70 million US users of Facebook and Myspace. Unfortunately the study was only based on a survey of US internet users so it is not possible to extrapolate this analysis across global internet users on a rigorous basis. However if we make the (over?) simplifying assumption that this study is indicative of general RSS use then based on approximately 1.5bn internet users worldwide this would give approximately 165 million RSS users worldwide. As penetration rates go I would say that was still pretty impressive. Obviously these calculations are more back of a postage stamp than back of an envelope :) but they illustrate the point that this percentage implies some fairly big numbers in absolute terms.

The other point to consider is the potential influence implications of RSS subscriptions. What would be really useful to know would be the detailed makeup of the 11% and the sites that they subscribe to. Were it the case for instance that this analysis showed that key influencers and decision makers in certain markets are proportionally more likely to receive their news via RSS its importance in influence terms would be magnified. If anyone has access to the full report and any information on this I would be delighted to hear from you.